Taco Bell
- $2,759,000
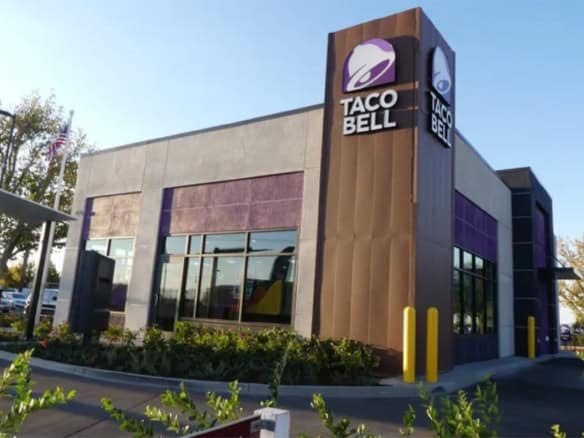
Taco Bell NNN for Sale in Charlotte, NC — $2.8M | 4.35% Cap
Charlotte, North Carolina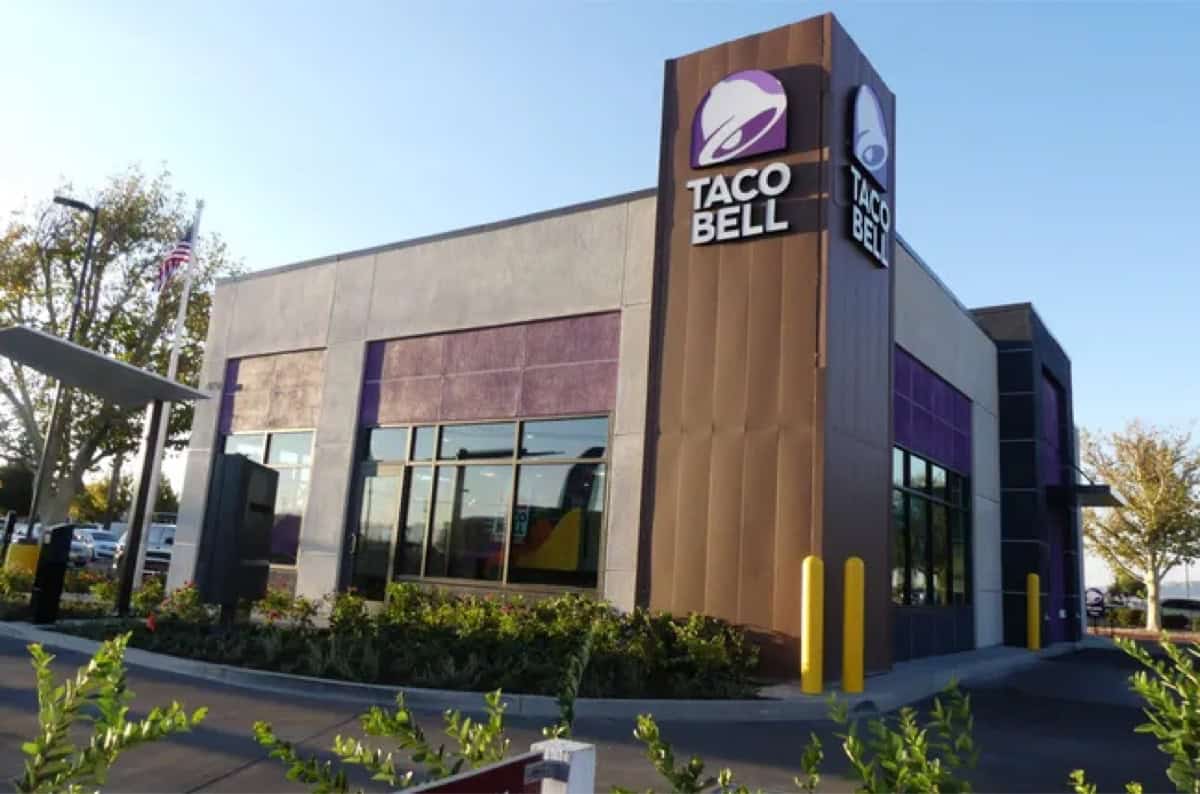
Taco Bell
- $2,759,000
Taco Bell NNN for Sale in Charlotte, NC — $2.8M | 4.35% Cap
Charlotte, North CarolinaTaco Bell NNN Properties for Sale — Mexican QSR Triple Net Lease Investments
Taco Bell NNN properties offer passive income investors the powerful combination of Yum! Brands BBB+ investment-grade credit (parent company owns KFC, Pizza Hut, Habit Burger creating $6B revenue Fortune 500), 7,500+ US locations (largest Mexican-American QSR chain beating Chipotle 3,500), Gen Z brand dominance (#1 QSR among 18-34 demographics, social media savvy, value menu appeal), late-night daypart (40% sales 8pm-close, unique revenue stream competitors lack), 15-20 year NNN leases (franchise or corporate guarantee depending on operator), and 5.5-6.5% cap rates (QSR sector standard reflecting drive-thru traffic resilience) creating exceptional conditions for long-term triple net lease cash flow in America’s value Mexican fast food leader.
American Net Lease specializes in Taco Bell NNN investments across suburban, urban, and highway corridor markets nationwide. Browse current listings or call 239.236.2626 to discuss exclusive Taco Bell opportunities.
Why Invest in Taco Bell NNN Properties?
Taco Bell combines Yum! Brands Fortune 500 backing (BBB+ credit, strongest in QSR sector) with Mexican-American menu differentiation—value pricing ($5-$8 average check, inflation-resistant), Gen Z loyalty (social media engagement, app adoption 40%+ transactions), late-night daypart dominance (40% sales after 8pm when competitors closed), drive-thru optimization (80%+ locations have drive-thru, COVID-accelerated off-premise), 7,500+ locations provide geographic diversity, and franchise model (95% franchisee-operated creating entrepreneurial operator commitment) making Taco Bell NNN properties ideal for investors seeking stable cash flow in recession-resistant QSR sector.
1. Yum! Brands BBB+ Credit — Fortune 500 QSR Leader
Taco Bell operates under Yum! Brands parent company (BBB+ investment-grade credit S&P, highest among major QSR chains), owning KFC, Pizza Hut, Taco Bell, Habit Burger creating $6B combined revenue (Fortune 500, global scale), 55,000+ restaurants worldwide (39,000 KFC, 19,000 Pizza Hut, 8,500 Taco Bell, 300 Habit), franchise-heavy model (98% franchised globally, asset-light), and dividend aristocrat (consistent dividend growth, shareholder-friendly) providing Taco Bell NNN investors with institutional-quality tenant backed by diversified restaurant portfolio.
Yum! Brands financial metrics (2024):
- System sales: $6B+ Yum! Brands (all concepts combined)
- Taco Bell US: $14B system sales (franchisee + corporate)
- Credit rating: BBB+ (S&P, one notch above BBB mid-tier)
- Market cap: $35B+ (NYSE: YUM, institutional ownership)
- Dividend: 2.5% yield (shareholder-friendly, stable)
Why BBB+ matters (higher than most QSR):
- BBB+ > BBB: One notch above mid-tier investment-grade (stronger credit)
- Comparison: McDonald’s A- (higher), Wendy’s BBB (lower), Burger King BBB- (lower)
- Lender-friendly: 75% LTV typical (vs 70% BBB, 65% BBB-)
- Institutional buyers: REITs prefer BBB+ (exit liquidity advantage)
Yum! Brands portfolio diversification:
- KFC: 39,000 locations (largest, fried chicken global leader)
- Pizza Hut: 19,000 locations (pizza delivery/dine-in)
- Taco Bell: 8,500 locations (Mexican-American, US-focused)
- Habit Burger: 300 locations (premium burger, small but growing)
2. 7,500+ US Locations — Largest Mexican-American QSR
Taco Bell operates 7,500+ US locations (8,500+ globally including international) making it largest Mexican-American QSR chain (beating Chipotle 3,500, Qdoba 750, Del Taco 600), nationwide coverage (all 50 states, dense suburban/urban), drive-thru dominant (80%+ locations have drive-thru, COVID-accelerated off-premise 80% sales), and new unit development (200-300 annually, expansion continues despite saturation) providing NNN investors with abundant deal flow and geographic market selection.
Store footprint:
- Total US stores: 7,500+ (all 50 states)
- Global total: 8,500+ (US + international Mexico, India, UK)
- Format: Drive-thru 80%, inline 15%, freestanding 75%
- New openings: 200-300 annually (expansion continues)
Top Taco Bell markets:
- California: 800+ stores (largest state, Hispanic population)
- Texas: 700+ stores (second-largest, Mexican food affinity)
- Florida: 500+ stores (third-largest, tourism + population)
- Ohio: 400+ stores (Midwest density, originated Midwest)
- Arizona: 300+ stores (Southwest, authentic Mexican competition)
Drive-thru penetration (COVID accelerated):
- Pre-COVID (2019): 70% locations with drive-thru, 60% sales
- Post-COVID (2024): 80% locations with drive-thru, 80% sales
- Digital integration: Mobile app orders, drive-thru pickup lanes
- Off-premise focus: Drive-thru + delivery + mobile = 85% total sales
3. Gen Z Brand Dominance — #1 QSR Among 18-34
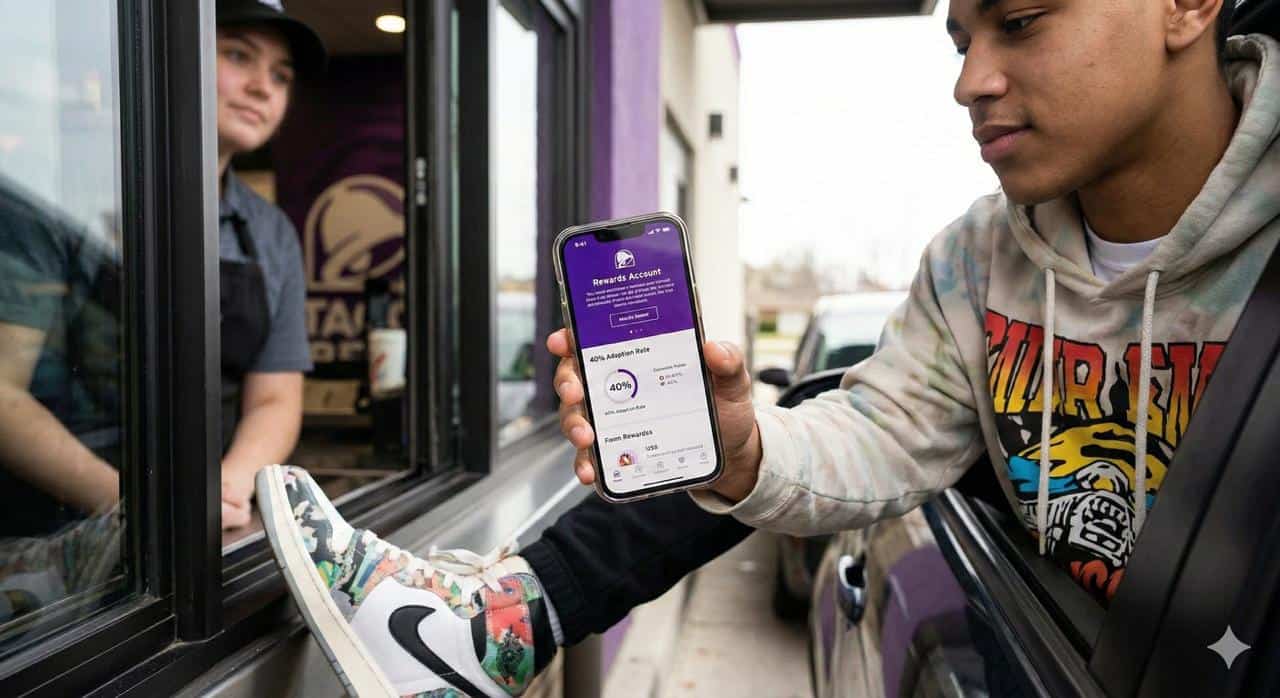
Taco Bell is #1 QSR brand among Gen Z (18-34 age demo, 40% customer base), driven by social media savvy (TikTok, Instagram engagement higher than McDonald’s), value menu innovation ($2-$5 Cravings Value Menu, inflation-resistant), late-night positioning (“Fourthmeal” campaign, 8pm-close 40% sales), customization appeal (Taco Bell app allows infinite ingredient combinations), and brand loyalty (Gen Z views Taco Bell as “their brand” vs Boomer McDonald’s) creating sustainable long-term traffic as Gen Z ages into prime earning years (25-45).
Gen Z customer metrics:
- Age 18-34: 40% of Taco Bell customers (vs McDonald’s 30%, Wendy’s 25%)
- App adoption: 40%+ transactions via mobile app (highest in QSR)
- Social media: 12M+ TikTok followers (2x Wendy’s, 3x Burger King)
- Brand perception: “Authentic,” “fun,” “affordable” (Gen Z values)
Value menu innovation (inflation hedge):
- $2-$5 Cravings Value Menu: Cheesy Gordita Crunch, Beefy 5-Layer, Crunchwrap
- Taco Tuesday: $0.99 tacos (traffic driver, loss leader)
- Limited-time offers: Nacho Fries (returns every 6 months, creates urgency)
- Breakfast daypart: $1-$3 breakfast burritos (2014 launch, 10% sales)
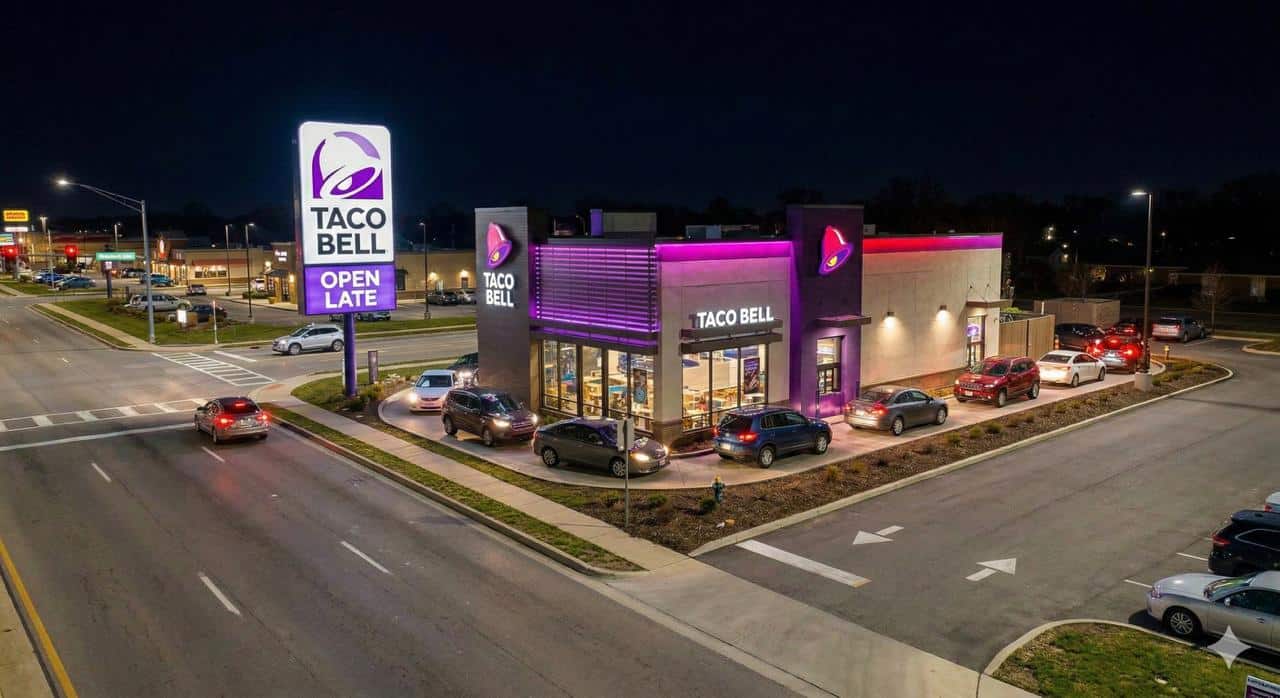
Late-night daypart (40% sales 8pm-close):
- Unique positioning: McDonald’s/Wendy’s close 11pm-12am, Taco Bell open until 2-4am
- College towns: Late-night essential (students, bars close)
- Highway corridors: Truckers, travelers, late-shift workers
- Margin benefit: Late-night labor cheaper (fewer staff, higher margins)
4. 15-20 Year NNN Leases — Franchise vs Corporate Guarantee
Taco Bell leases are typically 15-20 year initial terms with NNN structure (tenant pays property taxes, insurance, maintenance), 1.5-2% annual rent escalations (10% every 5 years alternatives), renewal options (2-3 five-year renewals, 30-40 year total), but guarantee varies by operator: franchise-operated (95% of stores, franchisee guarantee weaker than corporate) vs corporate-operated (5% of stores, Yum! Brands corporate guarantee stronger) requiring careful due diligence on guarantor creditworthiness.
Taco Bell lease structure:
- Initial term: 15-20 years (new builds 20, existing 15)
- Lease type: NNN (tenant pays taxes, insurance, maintenance)
- Roof responsibility: Varies (some franchise leases landlord pays roof, verify)
- Rent escalations: 1.5-2% annual OR 10% every 5 years
- Renewal options: 2-3 five-year renewals (total 30-40 years)
CRITICAL: Franchise vs corporate guarantee
Franchise-operated (95% of Taco Bell stores):
- Guarantor: Individual franchisee LLC (NOT Yum! Brands corporate)
- Credit strength: Varies widely (some franchisees $50M+ revenue strong, others $5M weak)
- Due diligence: Request franchisee financials (P&L, balance sheet, tax returns)
- Lender impact: 65-70% LTV typical (lower than corporate guarantee)
- Cap rates: 5.5-6.5% (varies by franchisee strength)
Corporate-operated (5% of Taco Bell stores):
- Guarantor: Yum! Brands corporate (BBB+ credit)
- Credit strength: Institutional (Fortune 500, $6B revenue)
- Due diligence: Minimal (Yum! Brands public, financials transparent)
- Lender impact: 75-80% LTV (highest QSR financing)
- Cap rates: 5.0-5.5% (lower cap = higher pricing, reflects quality)
How to verify guarantee:
- Request lease document (full executed lease)
- Find “Guarantor” section (Article 10-15 typically)
- Verify name: “Yum! Brands” = corporate (rare, preferred) OR “[Franchisee Name] LLC” = franchise (common)
- Request franchisee financials if franchise guarantee
5. 5.5-6.5% Cap Rates — QSR Sector Standard
Taco Bell NNN properties typically trade at 5.5-6.5% cap rates (depending on location, franchisee strength, lease term), lower than dollar stores (7.0-8.0%), lower than gas/c-store (6.0-7.0%), similar to pharmacy (5.5-6.5%), and similar to other QSR (McDonald’s 5.0-6.0%, Chick-fil-A 5.0-5.5%, Wendy’s 6.0-6.5%) reflecting drive-thru traffic resilience, Yum! Brands institutional backing, and QSR sector investor preference.
Cap rate ranges by guarantee type:
- Corporate guarantee (Yum! Brands): 5.0-5.5% (rare, premium pricing)
- Strong franchisee (multi-unit operator, $50M+ sales): 5.5-6.0%
- Average franchisee (5-10 units, $20M sales): 6.0-6.5%
- Weak franchisee (1-2 units, <$10M sales): 6.5-7.0% or avoid
Comparison to other QSR:
| Tenant | Cap Rate | Credit Rating | Drive-Thru % | Daypart |
|---|---|---|---|---|
| Taco Bell | 5.5-6.5% | BBB+ (Yum) | 80% | Late-night |
| McDonald’s | 5.0-6.0% | A- (corporate) | 95% | All-day |
| Chick-fil-A | 5.0-5.5% | Unrated (AAA-like) | 90% | Lunch/dinner |
| Wendy’s | 6.0-6.5% | BBB (corporate) | 85% | All-day |
| Chipotle | 5.5-6.5% | Unrated (strong) | 60% Chipotlane | Lunch/dinner |
Why Taco Bell similar cap to Wendy’s (both 6.0-6.5%):
- Franchise model: Both 95%+ franchised (vs McDonald’s 95% but stronger franchisees)
- BBB+/BBB credit: Yum BBB+ vs Wendy’s BBB (similar tier)
- Menu positioning: Both value-focused ($5-$8 check vs McDonald’s $8-$10)
6. Recession-Resistant Value Positioning — $5-$8 Average Check
Taco Bell’s $5-$8 average check (lower than Chipotle $12-$15, McDonald’s $8-$10) creates recession-resistant traffic: value menu drives frequency (customers visit 2-3x/month vs 1x), trade-down destination (Chipotle/fast-casual customers trade down to Taco Bell during inflation), inflation pricing power ($0.10-$0.20 price increases annually absorbed), and essential quick-service positioning (eating out necessity, not luxury dining) ensuring sustained sales supporting rent payments regardless of economic cycles.
Value menu strategy:
- $2-$5 Cravings Value Menu: Permanent menu (not promotional)
- $0.99 Taco Tuesday: Traffic driver (loss leader, brings customers weekly)
- $1-$3 breakfast: Morning daypart (10% sales, growing)
- Customization: App allows infinite combinations at fixed prices
Recession performance (historical):
- 2008-2009 recession: Taco Bell traffic +5% (trade-down from Chipotle/sit-down)
- 2020 COVID-19: Drive-thru only, sales -5% year 1, +8% year 2 (recovery)
- 2023 inflation: Taco Bell traffic flat (vs Chipotle -5%, trade-down benefit)
How to Evaluate Taco Bell NNN Properties
1. Verify Franchisee Strength (MOST CRITICAL)
Request franchisee financials:
- P&L (Profit & Loss): Last 2 years (verify profitability, sales trends)
- Balance sheet: Assets vs liabilities (solvency check)
- Tax returns: Verify P&L accuracy (IRS filings don’t lie)
- Store count: How many Taco Bells does franchisee own? (1-2 = weak, 10+ = strong)
Strong franchisee indicators:
- ✅ Multi-unit operator (10+ Taco Bells, diversified)
- ✅ $50M+ annual revenue (scale, purchasing power)
- ✅ EBITDA margins 15%+ (healthy profitability)
- ✅ Low debt (debt-to-EBITDA <3x)
- ✅ Track record (10+ years operating, no bankruptcies)
Weak franchisee red flags:
- ❌ Single-unit operator (1-2 stores, no diversification)
- ❌ <$5M annual revenue (subscale, vulnerable)
- ❌ EBITDA margins <10% (barely profitable)
- ❌ High debt (debt-to-EBITDA >5x)
- ❌ Recent startup (<3 years, unproven)
2. Analyze Location & Drive-Thru Configuration
Ideal Taco Bell location:
- Drive-thru: MUST HAVE (80% sales, essential)
- Traffic count: 25,000+ vehicles/day (high-visibility arterial)
- Demographics: Middle-income $40K-$70K (value positioning)
- Proximity: Highway exit, college town, or suburban corridor
- Competition: Avoid oversaturation (3+ QSR within 1 mile = cannibalization)
Drive-thru critical:
- Without drive-thru: Cap rate 7.0-7.5% (higher risk, lower traffic)
- With drive-thru: Cap rate 5.5-6.5% (standard, essential)
- Double drive-thru: Cap rate 5.0-6.0% (premium, highest throughput)
3. Understand Lease Guarantee Structure
Verify in lease document:
- Guarantor name: Franchisee LLC or Yum! Brands corporate?
- Guarantee amount: Full lease OR capped at $X?
- Guarantee duration: Entire lease term OR first 10 years only?
- Guarantee conditions: Unconditional OR conditional on sales performance?
Ideal guarantee:
- ✅ Multi-unit franchisee with $50M+ revenue
- ✅ Unconditional guarantee (no sales conditions)
- ✅ Full lease term (not just first 10 years)
- ✅ Entire lease obligation (rent + CAM + taxes if applicable)
Taco Bell NNN Property Case Study
Taco Bell — Denver, CO (Suburban Drive-Thru)
Purchase price: $2,500,000
Cap rate: 6.0%
Annual NOI: $150,000
Lease term: 15 years remaining
Tenant: Taco Bell (franchisee: Mountain West QSR, 25+ locations)
Why this property works:
1. Strong multi-unit franchisee:
- Mountain West QSR: 25 Taco Bell locations (Colorado/Wyoming)
- $80M annual revenue: Multi-state operator (scale, creditworthy)
- 15 years operating: Established, proven track record
- Financial strength: Requested P&L shows 18% EBITDA margins (healthy)
2. Excellent Denver suburban location:
- Drive-thru: Double lane (highest throughput configuration)
- Traffic count: 40,000 vehicles/day (major arterial corridor)
- Demographics: $68K median income (middle-income value positioning)
- College proximity: University of Denver 3 miles (late-night traffic)
3. Lease structure:
- 15 years remaining: Adequate term (expires 2039)
- NNN structure: Tenant pays property taxes ($25K), insurance, maintenance
- Rent escalations: 10% every 5 years (Year 15 rent $197K, +31%)
- Franchisee guarantee: Mountain West QSR (verified financials strong)
4. Financial performance:
- 6.0% cap rate: $150,000 NOI on $2.5M purchase (QSR standard)
- Leveraged return: 75% LTV = $1.875M loan, $625K equity, 11%+ cash-on-cash
- Rent growth: +31% by year 15 (10% every 5 years escalations)
Investor outcome:
- ✅ Strong franchisee (25 locations, $80M revenue, verified)
- ✅ Drive-thru double lane (80% sales, essential)
- ✅ Denver growth market (Sunbelt migration, Gen Z population)
- ✅ 6.0% cap = fair value (QSR standard for strong franchisee)
Frequently Asked Questions (FAQs)
Taco Bell franchise guarantee vs corporate guarantee — which is better?
Corporate guarantee (Yum! Brands BBB+) is FAR superior but extremely rare (<5% of Taco Bell stores). Corporate-guaranteed Taco Bell trades 5.0-5.5% cap (institutional pricing) with 75-80% LTV financing. Franchise guarantee (95% of stores) varies wildly—strong multi-unit franchisee ($50M+ revenue, 10+ stores) trades 5.5-6.0% cap with 70-75% LTV, weak single-unit franchisee (<$5M revenue) trades 6.5-7.0% cap with 60-65% LTV. CRITICAL: Request franchisee financials (P&L, balance sheet) during due diligence—treat each Taco Bell as unique investment based on franchisee creditworthiness, not blanket “Taco Bell = safe.”
Is Taco Bell recession-resistant or cyclical?
Recession-resistant due to value positioning. $5-$8 average check positions Taco Bell as trade-down destination—during 2008-2009 recession, Taco Bell traffic +5% as Chipotle/casual dining customers traded down for affordability. 2023 inflation: Taco Bell traffic flat while Chipotle -5% (consumers budget-conscious). Value menu ($2-$5 Cravings) sustains traffic regardless of economy. Drive-thru 80% sales = resilient (COVID proved off-premise survives). Late-night daypart (40% sales) = unique (McDonald’s/Wendy’s close 11pm, Taco Bell 2-4am captures shift workers/college students). Conclusion: Taco Bell is recession-resistant QSR, not bulletproof but better than casual dining.
What cap rates should I expect for Taco Bell NNN properties?
Taco Bell cap rates range 5.5-6.5% depending on franchisee strength, drive-thru configuration, and lease term. Corporate guarantee (rare): 5.0-5.5%. Strong franchisee (25+ stores, $50M+ revenue): 5.5-6.0%. Average franchisee (5-10 stores, $20M revenue): 6.0-6.5%. Weak franchisee (1-2 stores, <$5M): 6.5-7.0% or avoid. Drive-thru essential: Without drive-thru add +0.5-1.0% cap (higher risk). Comparison: Similar to Wendy’s 6.0-6.5%, lower than Dollar General 7.0-7.5%, higher than Chick-fil-A 5.0-5.5%.
Ready to Invest in Taco Bell NNN Properties?
American Net Lease specializes in Taco Bell triple net lease investments across drive-thru corridors, college markets, and suburban growth areas. Our QSR expertise, franchisee due diligence process, and Yum! Brands positioning create opportunities for NNN investors seeking stable cash flow in value Mexican fast food.
Browse our current inventory of Taco Bell NNN properties or call 239.236.2626 to discuss exclusive opportunities.
View Taco Bell NNN Properties | Download QSR NNN Guide | Schedule Consultation
Invest in Gen Z’s Favorite QSR. BBB+ Yum! Brands backing. Drive-thru resilience. Build wealth with Taco Bell NNN properties.