Popeyes Chicken
- $1,899,236
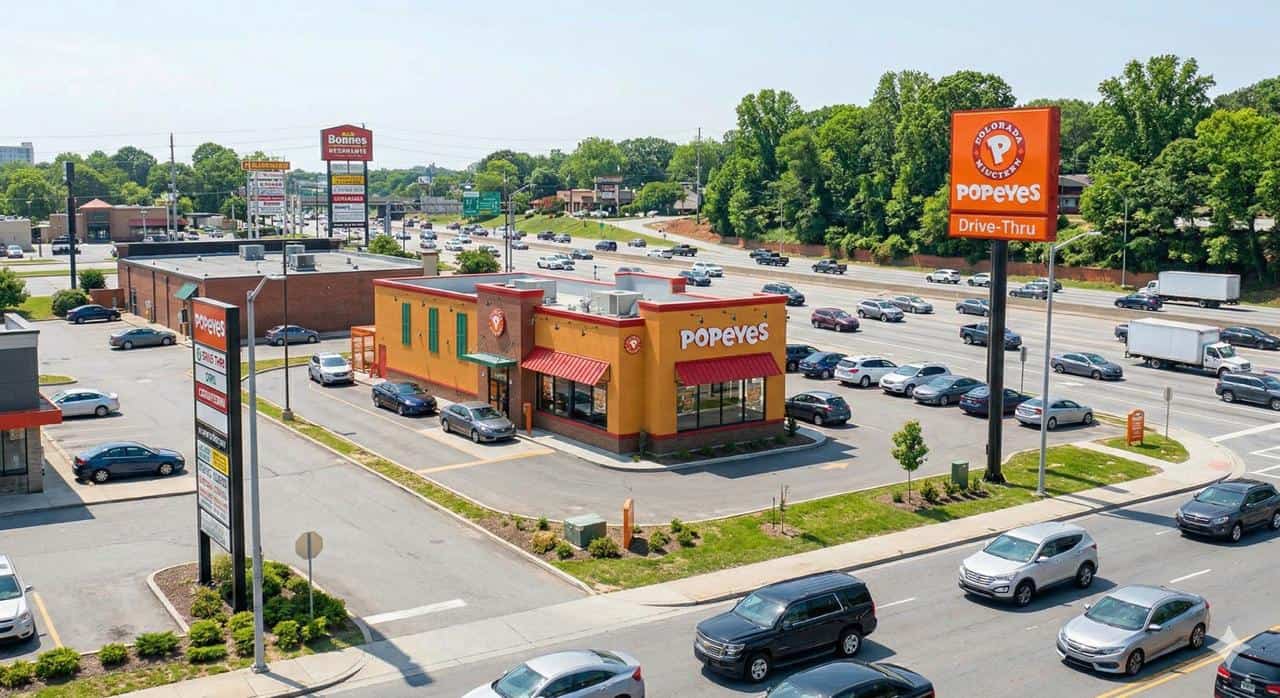
Popeyes NNN for Sale in Houston, TX — $1.9M | 5.5% Cap
Houston, Texas
Popeyes Chicken
- $1,899,236
Popeyes NNN for Sale in Houston, TX — $1.9M | 5.5% Cap
Houston, TexasPopeyes NNN Properties for Sale — Fastest-Growing Chicken QSR Triple Net Lease Investments
Popeyes NNN properties offer passive income investors the powerful combination of BBB- investment-grade credit rating (S&P, RBI corporate guarantee, same parent as Burger King and Tim Hortons), fastest-growing chicken QSR (same-store sales +5-10% annually, outpacing McDonald’s, Chick-fil-A, KFC), Louisiana Creole heritage brand differentiation (bold flavors, cultural cachet, distinct vs generic chicken), chicken sandwich phenomenon (2019 viral launch drove sustained traffic, cultural moment captured), 20+ year absolute NNN leases (RBI corporate guarantee, tenant pays all expenses), 3,600+ global locations (aggressive expansion 200+ annual openings), and 6.5-7.5% cap rates (higher yields than Chick-fil-A A+ 4.0-5.0%, compensating BBB- credit vs A+ tier) creating exceptional conditions for growth-focused NNN investors seeking exposure to America’s hottest chicken QSR category with RBI multi-brand portfolio backing.
American Net Lease specializes in Popeyes NNN investments across major metros, Sunbelt growth markets, and high-traffic QSR corridors. Browse current listings or call 239.236.2626 to discuss exclusive Popeyes opportunities.
Why Invest in Popeyes NNN Properties?
Popeyes combines BBB- investment-grade credit with fastest-growing chicken QSR positioning—same-store sales +5-10% annually (outpacing all major QSR competitors including McDonald’s +3-5%, Chick-fil-A +3-6%, KFC flat/declining) driven by chicken sandwich phenomenon cultural relevance, Louisiana Creole heritage brand strength, aggressive expansion trajectory (200+ new locations annually), RBI corporate guarantee backing ($7B revenue multi-brand portfolio with Burger King and Tim Hortons providing diversification), and 20+ year absolute NNN leases protecting investors from operational challenges making Popeyes NNN properties ideal for growth-focused investors seeking higher yields (6.5-7.5% caps) while maintaining investment-grade credit floor with explosive QSR growth trajectory.
1. BBB- Investment-Grade Credit — RBI Multi-Brand Portfolio Backing (Same Parent as Burger King)
Popeyes holds a BBB- credit rating from S&P (investment-grade, lowest tier before junk bonds, RBI corporate guarantee), backed by Restaurant Brands International parent company ($7B+ revenue, $35B market cap, NYSE: QSR, also owns Burger King + Tim Hortons + Firehouse Subs), $5B global revenue from Popeyes brand alone (3,600+ locations worldwide, fastest-growing RBI brand), 99% franchised model (corporate focuses on brand/marketing, franchisees operate stores), and 3G Capital management (Brazilian PE firm, operational excellence, AB InBev/Kraft Heinz turnaround expertise) providing lender confidence despite lower-tier investment-grade credit while offering multi-brand portfolio diversification where investors can own BOTH Burger King AND Popeyes NNN properties backed by same RBI corporate parent.
Popeyes financial metrics (2024, RBI segment):
- Global revenue: $5B+ (Popeyes brand, 3,600+ locations worldwide)
- US revenue: $2B+ (1,700+ US locations, strongest growth market)
- Same-store sales: +5-10% annually (fastest-growing major chicken QSR)
- Unit economics: $1.8M average unit volume (strong franchisee profitability)
- Expansion: 200+ new locations annually (aggressive growth trajectory)
RBI corporate parent strength:
- RBI total revenue: $7B+ (multi-brand portfolio: Tim Hortons $4B, Burger King $2B, Popeyes $5B global)
- Market cap: $35B+ (publicly traded NYSE: QSR, institutional ownership 85%+)
- Brands owned: Tim Hortons (4,000+ locations, Canada coffee leader), Burger King (18,000+ global, 7,000 US), Popeyes (3,600+ global, 1,700 US), Firehouse Subs (1,200+ locations)
- Dividend yield: 3-4% (quarterly distributions, shareholder-friendly)
- 3G Capital backing: Operational expertise, zero-based budgeting, margin expansion focus
Credit rating significance:
- BBB- investment-grade: Lowest tier before junk bonds BB+ (12th of 22 S&P ratings)
- RBI corporate guarantee: Popeyes leases guaranteed by RBI parent company ($7B revenue, not individual franchisee)
- Lender-friendly: 65-70% LTV typical (vs junk bonds 50-60% LTV)
- Multi-brand backing: If Popeyes struggles, Tim Hortons/Burger King revenue offsets (portfolio stability)
Investment thesis: Popeyes BBB- investment-grade credit (lowest tier, but still above junk) backed by RBI multi-brand portfolio ($7B revenue, Tim Hortons + Burger King + Popeyes diversification) provides corporate guarantee protection while delivering 6.5-7.5% cap rates (higher yields compensating lower-tier IG credit).
2. Fastest-Growing Chicken QSR — Same-Store Sales +5-10% Annually (Outpacing All Major Competitors)
Popeyes is the fastest-growing major chicken QSR with same-store sales +5-10% annually (2020-2024 consistent growth), outpacing all competitors including McDonald’s +3-5%, Chick-fil-A +3-6%, KFC flat/declining, driven by chicken sandwich phenomenon (2019 viral launch created sustained traffic), Louisiana Creole brand strength (bold flavors, cultural relevance), menu innovation (new chicken tenders, wings, sides rotating), aggressive expansion (200+ new locations annually), and 7-day operation (open Sundays unlike Chick-fil-A, capturing weekend traffic) creating tenant strength supporting long-term NNN lease payment reliability despite BBB- credit rating.
Popeyes growth metrics (2020-2024):
- Same-store sales: +5-10% annually (FASTEST major chicken QSR)
- Unit count growth: +7-10% annually (200+ new locations/year)
- Digital sales: 40%+ of revenue (mobile app, delivery partnerships)
- Average unit volume: $1.8M (strong franchisee economics, profit margins 15-18%)
Comparison to chicken QSR competitors:
- Popeyes: +5-10% same-store sales (FASTEST growth, chicken sandwich phenomenon)
- Chick-fil-A: +3-6% same-store sales (strong but slower, closed Sundays limits growth)
- KFC: Flat to -2% same-store sales (struggling brand, losing relevance)
- Zaxby’s: +3-5% same-store sales (regional, growing but smaller scale)
- Raising Cane’s: +8-12% same-store sales (fast-growing but limited menu)
Why Popeyes growth matters for NNN investors:
- Tenant strength: +5-10% sales growth = higher franchisee profits = lease payment reliability
- Expansion trajectory: 200+ new stores annually proves corporate commitment (not contraction)
- Renewal likelihood: Growing brands renew leases (vs declining brands abandon locations)
- Property value: Growth tenants command lower cap rates over time (if Popeyes upgrades to BBB credit, cap compresses = value appreciation)
Chicken sandwich phenomenon (2019-2024):
- 2019 launch: Popeyes chicken sandwich went viral (lines around blocks, sold out nationally)
- Cultural moment: Social media frenzy, comparisons to Chick-fil-A (Popeyes “won”)
- Sustained traffic: 2020-2024 same-store sales +5-10% (not temporary fad, permanent relevance)
- Menu innovation: Chicken sandwich drove trial, customers stayed for full menu (Louisiana sides, biscuits)
Investment thesis: Popeyes fastest-growing chicken QSR (+5-10% same-store sales, outpacing McDonald’s/Chick-fil-A/KFC) creates tenant strength supporting NNN lease payments—growing brands = reliable franchisees = long-term property value.
3. Louisiana Creole Heritage — Brand Differentiation (Bold Flavors, Cultural Cachet vs Generic Chicken)
Popeyes leverages Louisiana Creole heritage (founded 1972 New Orleans, Cajun/Creole flavors, Southern cultural authenticity) creating brand differentiation vs generic chicken competitors (KFC factory-fried, Chick-fil-A vanilla Christian positioning), bold flavor profile (spicy cayenne rub, buttermilk biscuits, red beans & rice, Cajun fries), cultural relevance (Black-owned heritage pre-RBI, community connection, urban market strength), menu uniqueness (only major QSR serving authentic Louisiana sides), and premium positioning ($8-10 meal combos vs KFC $6-8, justified by flavor superiority) supporting pricing power and customer loyalty differentiating Popeyes from commodity chicken QSR competitors.
Louisiana heritage advantages:
- Authentic flavors: Cajun/Creole spice blends (not generic KFC 11 herbs/spices)
- Southern cultural cachet: New Orleans roots (Jazz, Mardi Gras, culinary heritage)
- Menu differentiation: Red beans & rice, Cajun fries, buttermilk biscuits (unique sides vs competitors)
- Spice preference: Bold flavors appeal to diverse demographics (urban, multicultural, younger)
Brand positioning vs competitors:
- Popeyes: Louisiana Creole heritage, bold flavors, cultural authenticity, urban strength
- Chick-fil-A: Christian values, vanilla positioning, suburban focus, closed Sundays
- KFC: Generic fried chicken, factory-made, declining relevance, no differentiation
- Raising Cane’s: Limited menu (only chicken fingers), no sides variety
- Zaxby’s: Regional Southern (lacks national scale), similar to Popeyes but smaller
Pricing power (brand strength = premium pricing):
- Popeyes: $8-10 meal combos (chicken sandwich, fries, drink)
- KFC: $6-8 meal combos (commodity pricing, no premium)
- Chick-fil-A: $9-12 meal combos (Christian brand premium, suburban affluence)
- McDonald’s: $6-8 meal combos (value positioning)
Why Louisiana heritage matters for NNN investors:
- Brand moat: Unique positioning vs commoditized competitors (KFC generic, hard to differentiate)
- Pricing power: Bold flavors justify $8-10 combos (vs KFC $6-8 value positioning)
- Customer loyalty: Cultural connection creates repeat visits (vs transactional KFC)
- Menu innovation: Louisiana heritage enables authentic new products (vs KFC limited innovation)
Investment thesis: Popeyes Louisiana Creole heritage creates brand differentiation supporting pricing power, customer loyalty, and competitive moat—unique positioning vs commodity chicken QSR competitors protects franchisee profitability and NNN lease payment reliability.
4. 20+ Year RBI Corporate Guaranteed NNN Leases — Multi-Brand Portfolio Protection
Popeyes typically signs 20-25 year absolute NNN leases with RBI corporate guarantee (Restaurant Brands International parent company backing, $7B revenue, NOT individual franchisee credit), minimal landlord responsibilities (tenant pays property taxes, insurance, maintenance, roof, HVAC, parking lot), rent escalations (1.5-2% annual increases or 10% every 5 years), and renewal options (2-4 five-year renewals, 40-60 year total potential) providing investors with structural protection—even if individual Popeyes franchisee struggles, RBI corporate guarantee (backed by Tim Hortons + Burger King + Popeyes + Firehouse Subs multi-brand portfolio) ensures rent payments continue insulating NNN investors from operational challenges.
Typical Popeyes NNN lease structure:
- Lease term: 20-25 years initial (new construction/ground lease)
- Remaining term: 10-20 years typical (existing properties for sale)
- Rent escalations: 1.5-2% annual increases OR 10-15% every 5 years
- Renewal options: 2-4 five-year renewals (40-60 year total potential)
- Guarantee: RBI corporate (Restaurant Brands International Inc., $7B revenue, not franchisee)
Absolute NNN structure:
- Property taxes: Tenant pays (landlord collects rent only)
- Insurance: Tenant pays (building, liability, all coverage)
- Maintenance: Tenant pays (roof, HVAC, parking lot, landscaping)
- Structural: Tenant pays (even foundation, major repairs)
- Landlord: Collects rent checks, zero operating expenses
RBI corporate guarantee strength (MULTI-BRAND PORTFOLIO!):
- RBI revenue: $7B+ (Tim Hortons $4B, Burger King $2B, Popeyes $5B global)
- Diversification: If Popeyes struggles, Tim Hortons/Burger King revenue offsets (portfolio stability)
- 3G Capital management: Operational expertise (AB InBev, Kraft Heinz turnarounds)
- Lease survives struggles: Even if individual Popeyes closes, RBI pays rent through lease term
Rent escalation examples:
- Annual 1.5%: $100K base rent → $130K year 20 (30% increase compound)
- Annual 2.0%: $100K base rent → $149K year 20 (49% increase compound)
- 10% every 5 years: $100K → $110K year 5 → $121K year 10 → $133K year 15 → $146K year 20
Investment thesis: Popeyes 20-25 year RBI corporate guaranteed leases provide multi-brand portfolio protection—even if Popeyes struggles, Tim Hortons + Burger King revenue ($6B+ combined) supports corporate guarantee ensuring NNN lease payment reliability.
5. 3,600+ Global Locations — Aggressive Expansion 200+ Annual Openings (Growth Trajectory)
Popeyes operates 3,600+ global locations (1,700+ US, 1,900+ international, 99% franchised model) with aggressive expansion (200+ new locations annually, targeting 10,000+ global stores long-term), high-traffic QSR formats (2,200-2,800 sq ft freestanding, drive-thru focused), Sunbelt/urban concentration (Texas 180+ stores, California 150+, Florida 140+, Georgia 100+), international growth (Caribbean, UK, Middle East, Asia markets), and RBI capital support (parent company funding franchisee expansion, site selection expertise) creating abundant NNN investment opportunities with nationwide geographic diversification and tenant growth trajectory supporting long-term lease renewals.
Popeyes store footprint:
- Total global stores: 3,600+ (1,700+ US, 1,900+ international)
- New openings: 200+ annually (aggressive expansion, not contraction)
- Franchise model: 99% franchised (RBI corporate-owned minimal, franchisees operate)
- Target: 10,000+ global stores long-term (RBI expansion vision)
Top Popeyes US markets (store concentration):
- Texas: 180+ stores (Dallas/Houston/San Antonio/Austin metros, zero tax, Sunbelt growth)
- California: 150+ stores (Los Angeles/San Diego/San Francisco, high-traffic urban)
- Florida: 140+ stores (Miami/Tampa/Orlando, zero tax, Sunbelt)
- Georgia: 100+ stores (Atlanta metro dominance, Southeast hub)
- Louisiana: 80+ stores (heritage market, New Orleans roots)
Store format (typical NNN property):
- Building size: 2,200-2,800 sq ft (single-tenant freestanding QSR)
- Lot size: 30,000-45,000 sq ft (drive-thru lanes, parking 20-30 vehicles)
- Location: High-visibility corner (traffic lights, arterial roads, urban corridors)
- Drive-thru: Single or dual-lane (60-70% of sales, speed of service critical)
- Signage: Tall pylon sign (Popeyes orange/red branding, Louisiana imagery)
Expansion strategy:
- Sunbelt focus: Texas, Florida, Georgia, Arizona (population growth, zero tax states)
- Urban markets: High-density metros (Los Angeles, Atlanta, Miami strong Popeyes demographics)
- Ghost kitchens: Delivery-only formats (DoorDash, Uber Eats partnerships, off-premise 30%+ sales)
- International: Caribbean (Jamaica, Bahamas), UK, Middle East, Asia (global brand building)
Investment thesis: Popeyes 3,600+ global locations (200+ annual openings) prove expansion trajectory—growing brands renew leases and open new stores (vs declining brands closing locations) supporting NNN investor confidence in long-term tenant strength.
6. 6.5-7.5% Cap Rates — Higher Yields Than Chick-fil-A A+ (BBB- Credit Compensation)
Popeyes NNN properties typically trade at 6.5-7.5% cap rates (2.5-3.5% higher than Chick-fil-A A+ equivalent 4.0-5.0%, reflecting BBB- credit tier vs A+ tier difference), providing investors with growth QSR exposure at value pricing—higher yields compensate BBB- credit risk (lowest investment-grade tier) while maintaining lender-friendly financing (65-70% LTV vs junk bonds 50-60% LTV), RBI corporate guarantee protection ($7B multi-brand portfolio backing), and fastest-growing chicken QSR fundamentals (+5-10% same-store sales) creating optimal risk/return for investors seeking higher passive income with explosive growth tenant.
Popeyes cap rate ranges (by market tier):
- Primary metros: 6.5-7.0% (Dallas, Houston, Phoenix, Atlanta, Miami high-growth Sunbelt)
- Secondary markets: 7.0-7.5% (regional metros, Southeast/Southwest corridors)
- Tertiary/rural: 7.5-8.0% (small markets, higher risk)
Cap rate comparison (chicken QSR sector):
- Chick-fil-A: 4.0-5.0% (A+ equivalent credit, corporate-owned, closed Sundays operational risk)
- Popeyes: 6.5-7.5% (BBB- credit, 99% franchised, 7-day operation, FASTEST growth)
- KFC: 5.5-6.5% (BBB credit Yum! Brands, struggling brand, flat/declining sales)
- Zaxby’s: 6.0-7.0% (private company, regional, growing but smaller scale)
- Raising Cane’s: 5.5-6.5% (private, fast-growing, limited menu risk)
Why 6.5-7.5% cap rates = value opportunity:
- Growth premium: Popeyes +5-10% same-store sales vs Chick-fil-A +3-6% (faster growth, similar/higher caps!)
- 7-day operation: Open Sundays (vs Chick-fil-A closed, capturing weekend traffic)
- BBB- credit: Still investment-grade (lender-friendly 65-70% LTV, not junk bonds)
- RBI backing: Corporate guarantee from $7B multi-brand portfolio (Tim Hortons + Burger King offset risk)
Example cash flow comparison ($2.8M property):
- Chick-fil-A A+ @ 4.5% cap: $126K NOI ($10,500/month, ultra-low yields)
- Popeyes BBB- @ 7.0% cap: $196K NOI ($16,333/month, +$70K/year income vs Chick-fil-A!)
- Income premium: Popeyes generates $70K/year MORE (+56% higher!) accepting BBB- vs A+ credit
Investment thesis: Popeyes 6.5-7.5% cap rates deliver highest chicken QSR yields (vs Chick-fil-A 4.0-5.0%) while maintaining fastest growth (+5-10% same-store sales) and investment-grade credit floor (BBB-, lender-friendly)—optimal value for growth-focused NNN investors.
Popeyes Credit Strength & Financial Performance
S&P Credit Rating: BBB- (Investment-Grade, RBI Corporate Guarantee — Multi-Brand Portfolio Backing)
Popeyes holds a BBB- credit rating from S&P (investment-grade, lowest tier before junk bonds BB+, RBI corporate guarantee), reflecting $5B global revenue (Popeyes brand alone, 3,600+ locations), RBI parent company strength ($7B total revenue, $35B market cap, also owns Tim Hortons $4B + Burger King $2B + Firehouse Subs), fastest-growing major chicken QSR (+5-10% same-store sales, outpacing McDonald’s/Chick-fil-A/KFC), 99% franchised model (corporate focuses on brand, franchisees operate stores), 3G Capital operational expertise (zero-based budgeting, margin expansion), and aggressive expansion (200+ new locations annually) providing lenders with confidence in long-term lease payment reliability despite lower-tier investment-grade credit.
Credit rating breakdown:
- BBB- (S&P): Investment-grade (12th of 22 ratings, lowest tier before junk BB+)
- RBI corporate guarantee: Popeyes leases backed by RBI parent ($7B revenue, not franchisee)
- Multi-brand portfolio: If Popeyes struggles, Tim Hortons/Burger King revenue offsets ($6B+ combined)
- Lender treatment: 65-70% LTV typical (vs A+ Chick-fil-A 75-80%, but vs junk bonds 50-60% LTV)
What BBB- means for NNN investors:
- Still investment-grade: Above junk bonds (BB+ or lower = sub-investment)
- Lowest tier: 1 rating away from junk (turnaround/growth must succeed)
- Lender-friendly: 65-70% LTV financing available (institutional lenders accept BBB-)
- Higher yields: 6.5-7.5% caps compensate risk (vs Chick-fil-A 4.0-5.0%)
Key credit strengths:
- Fastest-growing QSR: +5-10% same-store sales (outpacing all major competitors)
- RBI multi-brand backing: $7B revenue portfolio (Tim Hortons + Burger King + Popeyes diversification)
- Expansion trajectory: 200+ new stores annually (growth mode, not contraction)
- Franchisee profitability: $1.8M average unit volume, 15-18% margins (strong economics support lease payments)
- 3G Capital expertise: Operational excellence, cost management (AB InBev, Kraft Heinz track record)
Credit concerns (why BBB- not higher):
- Lower-tier IG: Closest to junk bond line (1 downgrade away from BB+)
- Franchise dependency: 99% franchised = reliant on franchisee success (vs corporate-owned control)
- Competitive market: Chicken QSR competitive (Chick-fil-A dominance, KFC legacy, Raising Cane’s growth)
- RBI leverage: Parent company debt (consolidated basis, not Popeyes-specific)
Investment thesis: Popeyes BBB- investment-grade credit (lowest tier, but still above junk) backed by RBI multi-brand portfolio ($7B revenue, Tim Hortons + Burger King + Popeyes diversification) provides corporate guarantee protection ensuring lease payments continue even if individual franchisees struggle.
Types of Popeyes NNN Properties
Fee Simple (Building + Land) — Most Common
Structure: Investor owns both land and building improvements ($2.5-3.5M total), Popeyes franchisee operates store (RBI corporate guaranteed lease), tenant pays all expenses (NNN).
Advantages:
- Full ownership: Land + building (no lease expiration, perpetual ownership)
- Depreciation: Building improvements depreciable (tax benefits)
- RBI corporate guarantee: Restaurant Brands International backing ($7B revenue, multi-brand portfolio)
- Redevelopment: At lease end, repurpose building (convert to other QSR if Popeyes leaves)
Typical fee simple metrics:
- Purchase price: $2.5-3.5M (land + building)
- Cap rate: 6.5-7.5%
- Annual NOI: $162K-262K
- Lease term: 10-20 years remaining
Best for: Investors seeking full ownership, depreciation tax benefits, RBI corporate guarantee, growth QSR exposure.
Ground Leases (Less Common) — Land Ownership Only
Structure: Investor owns land ($1.5-2.5M), franchisee owns building improvements ($800K-1.2M), RBI corporate guaranteed lease, tenant pays all expenses (NNN).
Advantages:
- Lower purchase price: $1.5-2.5M land vs $2.5-3.5M fee simple
- RBI corporate guarantee: RBI backing (not individual franchisee credit risk)
- Reversion rights: At lease end, landlord owns land + building improvements
Typical ground lease metrics:
- Purchase price: $1.5-2.5M (land value only)
- Cap rate: 6.5-7.5%
- Annual NOI: $98K-187K
- Lease term: 15-20 years remaining
Best for: Investors seeking lower entry cost, RBI corporate guarantee, fastest-growing chicken QSR tenant.
New Construction vs Existing Locations
New construction:
- Lease term: 20-25 years (full initial term)
- Rent escalations: Built from day 1 (1.5-2% annual or 10% every 5 years)
- Building condition: Brand new (no deferred maintenance risk)
- Cap rate: 6.5-7.0% (lower due to longer term, new condition, growth tenant)
Existing location (resale):
- Lease term: 10-20 years remaining (portion of initial term)
- Rent escalations: Already occurred (some growth realized)
- Building condition: 5-15 years old (potential remodel needed)
- Cap rate: 7.0-7.5% (higher due to shorter term, older building)
Key Markets for Popeyes NNN Investment
Texas — 180+ Stores, Largest Popeyes Market
Why Texas for Popeyes:
- Store density: 180+ locations (largest Popeyes market, Dallas/Houston/San Antonio/Austin metros)
- Zero income tax: 0% state tax (investor advantage)
- Population growth: +16% 2010-2020 (fastest-growing large state, Sunbelt boom)
- Urban demographics: High-density metros favor Popeyes Louisiana flavors (diverse, multicultural)
Typical Texas Popeyes property:
- Location: Houston I-10, Dallas I-35, San Antonio I-410, Austin growth corridors
- Purchase price: $2.5-3.2M (fee simple), $1.8-2.4M (ground lease)
- Cap rate: 6.5-7.0%
- Annual NOI: $162K-224K
Investment thesis: Texas offers zero state tax + largest Popeyes market (180+ stores, dense network) + Sunbelt growth supporting NNN fundamentals.
California — 150+ Stores, Urban High-Traffic Metros
Why California for Popeyes:
- Store density: 150+ locations (Los Angeles, San Diego, San Francisco, Sacramento metros)
- Urban markets: High-traffic corridors (freeways, arterial roads, dense population)
- Diverse demographics: Multicultural population favors bold Louisiana flavors (vs vanilla Chick-fil-A suburban)
Typical California Popeyes property:
- Location: Los Angeles I-10/I-405, San Diego I-5, Bay Area urban corridors
- Purchase price: $3.0-4.0M (fee simple), $2.2-3.0M (ground lease)
- Cap rate: 6.5-7.0%
- Annual NOI: $195K-280K
Investment thesis: California urban high-traffic + diverse demographics support Popeyes Louisiana brand strength (bold flavors resonate vs generic competitors).
Florida — 140+ Stores, Sunbelt Growth + Zero Tax
Why Florida for Popeyes:
- Store density: 140+ locations (Miami, Tampa, Orlando, Jacksonville metros)
- Zero income tax: 0% state tax (investor advantage)
- Population growth: +15% 2010-2020 (Miami/Tampa/Orlando booms)
- Southern food culture: Popeyes Louisiana heritage resonates (vs California health-conscious)
Typical Florida Popeyes property:
- Location: Interstate 95 corridor, Orlando I-4, Tampa metro, Miami urban
- Purchase price: $2.8-3.6M (fee simple), $2.0-2.8M (ground lease)
- Cap rate: 6.5-7.0%
- Annual NOI: $182K-252K
Investment thesis: Florida offers zero state tax + Sunbelt growth + Southern food culture (Popeyes Louisiana positioning natural fit).
Georgia — 100+ Stores, Atlanta Metro Dominance
Why Georgia for Popeyes:
- Store density: 100+ locations (Atlanta metro concentration, Southeast hub)
- Urban demographics: High Black population (Popeyes cultural resonance, Louisiana heritage connection)
- Southeast growth: Atlanta I-285/I-85 corridors (high traffic, dense development)
Typical Georgia Popeyes property:
- Location: Atlanta I-285 Perimeter, I-85 corridor, Gwinnett County, Cobb County
- Purchase price: $2.6-3.4M (fee simple), $1.9-2.5M (ground lease)
- Cap rate: 6.5-7.0%
- Annual NOI: $169K-238K
Investment thesis: Georgia Atlanta metro dominance (100+ stores) + urban demographics support Popeyes cultural brand strength.
How to Evaluate Popeyes NNN Properties
1. Verify RBI Corporate Guarantee (CRITICAL — Multi-Brand Portfolio Protection)
What to check:
- Lease guarantor: Must be “Restaurant Brands International Inc.” (RBI corporate parent, $7B revenue)
- Guarantee clause: Review lease Section for RBI corporate guarantee language
- Multi-brand backing: RBI owns Tim Hortons + Burger King + Popeyes + Firehouse Subs (diversification!)
Why it matters: RBI corporate guarantee protects investor—even if individual Popeyes franchisee fails, RBI $7B revenue (Tim Hortons $4B + Burger King $2B + Popeyes $5B global) ensures rent payments continue.
Note: Popeyes is 99% franchised (not corporate-owned stores), so RBI corporate guarantee is CRITICAL to shift credit risk from franchisee unknown to RBI institutional backing.
2. Analyze Same-Store Sales Growth (Tenant Strength Indicator)
What to request from seller:
- Sales history: Last 3-5 years annual sales (verify +5-10% growth trend)
- Same-store sales: Year-over-year growth (Popeyes system average +5-10%)
- Chicken sandwich impact: 2019+ sales (verify sustained post-sandwich phenomenon traffic)
Healthy Popeyes indicators:
- Sales growth: +5-10% annually (matches Popeyes system, fastest-growing chicken QSR)
- Digital penetration: 40%+ digital/delivery sales (modern customer behavior)
- High AUV: $1.8M+ average unit volume (strong franchisee profitability)
Red flags:
- Declining sales: -3% or worse (market share loss, location underperformance)
- Low AUV: <$1.2M average unit volume (weak franchisee economics, lease payment risk)
- No chicken sandwich lift: Sales flat 2019-2024 (missed phenomenon, location weakness)
3. Assess Location Quality (High-Traffic Urban Corridors)
Strong Popeyes location:
- Traffic counts: 25,000+ daily vehicles (arterial road, urban corridor, high visibility)
- Urban/suburban mix: Dense population (Popeyes strength, vs rural Chick-fil-A)
- Drive-thru access: Easy ingress/egress (60-70% of sales drive-thru)
- No Chick-fil-A nearby: Popeyes competes better when Chick-fil-A absent (different demographics)
Location red flags:
- Low traffic: <15,000 daily vehicles (weak sales potential)
- Chick-fil-A adjacent: Within 1 mile (Chick-fil-A dominates suburban affluent, Popeyes struggles)
- Poor visibility: Mid-block, no pylon sign (impulse traffic lost)
- Rural location: Small town <25K population (Popeyes urban brand, weak rural)
4. Review Lease Term & Escalations
Ideal lease structure:
- Remaining term: 12+ years (long enough for financing, value stability)
- Rent escalations: 1.5-2% annual OR 10% every 5 years (inflation hedge)
- Renewal options: 2-4 five-year renewals (40-60 year total potential)
- RBI guarantee: Restaurant Brands International Inc. corporate backing ($7B revenue)
Example strong lease:
- 15 years remaining, 10% rent increase every 5 years, 3 five-year renewals, RBI corporate guaranteed
- Base rent $150K → $165K year 5 → $182K year 10 → $200K year 15
- Total rent growth: 33% over 15 years (inflation-adjusted income)
Red flag: No rent escalations (flat rent, inflation erodes real income), <10 years remaining (refinancing risk).
5. Calculate Cash Flow & Returns (Factor Growth Tenant Premium)
Example Popeyes property:
- Purchase price: $2.8M (fee simple, Sunbelt metro)
- Cap rate: 7.0%
- Annual NOI: $196,000 ($16,333/month)
- Lease term: 15 years remaining
- Rent escalations: 10% every 5 years
Financing scenario (70% LTV):
- Loan amount: $1.96M (70% LTV)
- Interest rate: 7.0%
- Loan term: 25-year amortization
- Annual debt service: $165,900
Cash flow analysis:
- NOI: $196,000
- Debt service: -$165,900
- Cash flow: $30,100/year ($2,508/month)
- Cash-on-cash return: 3.6% ($30,100 / $840K equity)
Year 5 (after 10% rent increase):
- New NOI: $215,600 ($196,000 × 1.10)
- Debt service: $165,900 (unchanged)
- Cash flow: $49,700/year ($4,142/month)
- Cash-on-cash return: 5.9% ($49,700 / $840K equity)
Year 10 (after 2nd 10% rent increase):
- New NOI: $237,160 ($215,600 × 1.10)
- Debt service: $165,900 (unchanged)
- Cash flow: $71,260/year ($5,938/month)
- Cash-on-cash return: 8.5% ($71,260 / $840K equity)
Investment thesis: Popeyes 7.0% cap generates $30,100 year 1 cash flow growing to $71,260 year 10—escalating income while holding fastest-growing chicken QSR tenant with RBI multi-brand backing.
Popeyes NNN Property Case Study
$2.8M Popeyes Fee Simple — Atlanta Metro (7.0% Cap)
Property details:
- Location: Atlanta I-285 Perimeter (South DeKalb, high-traffic urban corridor)
- Building size: 2,400 sq ft (freestanding chicken QSR, dual-lane drive-thru)
- Lot size: 38,000 sq ft (parking 25 vehicles, tall pylon sign)
- Year built: 2018 (modern facility, post-chicken sandwich launch)
- Purchase price: $2.8M (fee simple, investor owns land + building)
Lease structure:
- Tenant: Popeyes franchisee (multi-unit operator, 8 Atlanta-area Popeyes)
- Guarantor: Restaurant Brands International Inc. (RBI corporate guarantee, BBB- S&P credit, $7B revenue)
- Lease term: 16 years remaining (20-year initial signed 2020, 4 years elapsed)
- Rent escalations: 10% every 5 years (year 4, 9, 14)
- Renewal options: 3 five-year renewals (31 year total potential)
- NNN structure: Absolute (tenant pays all expenses, taxes, insurance, maintenance)
Financial performance:
- Annual rent (NOI): $196,000 (all NNN, landlord net)
- Cap rate: 7.0% ($196,000 / $2.8M)
- Monthly income: $16,333 (mailbox money, direct deposit)
Financing (70% LTV, typical for BBB- credit):
- Loan amount: $1.96M (70% of $2.8M)
- Down payment: $840K (30% equity)
- Interest rate: 7.0%
- Loan term: 25-year amortization
- Annual debt service: $165,900
- Monthly payment: $13,825
Cash flow analysis:
- NOI: $196,000
- Debt service: -$165,900
- Annual cash flow: $30,100 ($2,508/month)
- Cash-on-cash return: 3.6% ($30,100 / $840K equity)
Rent escalation projections:
- Year 4 (10% increase): $215,600 NOI → $49,700 cash flow (5.9% COC)
- Year 9 (10% increase): $237,160 NOI → $71,260 cash flow (8.5% COC)
- Year 14 (10% increase): $260,876 NOI → $94,976 cash flow (11.3% COC)
Investment highlights:
- ✅ RBI corporate guaranteed: Restaurant Brands International $7B revenue (Tim Hortons + Burger King + Popeyes multi-brand backing!)
- ✅ Atlanta urban corridor: I-285 Perimeter high traffic (45,000+ daily vehicles, dense demographics)
- ✅ Fastest-growing chicken QSR: Popeyes +5-10% same-store sales (outpacing Chick-fil-A, KFC)
- ✅ Post-chicken sandwich launch: 2018 construction capitalized on 2019 phenomenon (sales lift sustained)
- ✅ Multi-unit franchisee: Operator owns 8 Atlanta Popeyes (operational expertise, scale)
- ✅ 7.0% cap rate: Generates $196K NOI vs Chick-fil-A A+ 4.5% = $126K ($70K/year extra income!)
- ✅ Escalating income: 3.6% year 1 → 11.3% year 14 (cash-on-cash growth)
- ✅ Dual-lane drive-thru: Speed of service, capacity (60-70% sales drive-thru)
Why investor purchased: “I wanted exposure to fastest-growing chicken QSR without paying Chick-fil-A ultra-low 4.0-5.0% caps. Popeyes BBB- credit is STILL investment-grade (lender-friendly 70% LTV), and RBI corporate guarantee protects me from franchisee risk—Restaurant Brands International’s $7B revenue (Tim Hortons $4B + Burger King $2B + Popeyes $5B global) backs the lease. Atlanta I-285 is dense urban corridor (45,000+ daily vehicles), perfect for Popeyes Louisiana brand strength (vs Chick-fil-A suburban), and the 7.0% cap generates $196K NOI vs Chick-fil-A $126K on same $2.8M property—that’s $70K/year EXTRA income! Popeyes +5-10% same-store sales growth (fastest chicken QSR) tells me this tenant is WINNING. I’m getting paid 2.5% premium vs Chick-fil-A while holding hottest growth chicken QSR. That’s value.”
Total return over 16 years:
- Cash flow collected: $925,000 (cumulative over 16 years, escalating)
- Loan principal paydown: $510,000 (equity buildup via tenant rent payments)
- Building/land appreciation: $670,000 (assume 2.5% annual, conservative Atlanta growth)
- Total return: $2,105,000 on $840K initial investment (2.5x multiple, 16 years)
- Annualized return: 5.9% IRR (cash flow + paydown + appreciation)
Exit strategy (year 16):
- Remaining lease: 0 years initial, 15 years renewal options (3 five-year renewals)
- Likely scenario: Franchisee renews (strong Atlanta location, RBI expansion trajectory, multi-unit operator commitment)
- Sale value: $3.5M+ (land appreciation + income growth, 6.5% cap on $228K NOI year 16)
- Equity at sale: $3.0M+ (loan balance ~$500K remaining)
Frequently Asked Questions (FAQs)
Is Popeyes a good NNN investment compared to Chick-fil-A?
Popeyes and Chick-fil-A serve different investor priorities. Chick-fil-A offers A+ equivalent credit (highest QSR), corporate-owned stores (no franchise risk), proven operational model, BUT 4.0-5.0% cap rates (ultra-low yields) AND closed Sundays (operational risk, 14% lost revenue). Popeyes offers BBB- credit (lowest investment-grade), 99% franchised (RBI corporate guarantee critical), fastest-growing chicken QSR (+5-10% same-store sales), BUT 6.5-7.5% cap rates (2.5-3.5% HIGHER yields!) AND 7-day operation (open Sundays, capturing weekend traffic). Trade-off: Chick-fil-A = maximum safety, minimum income. Popeyes = growth exposure, higher income. Example: $2.8M property, Chick-fil-A 4.5% cap = $126K NOI, Popeyes 7.0% cap = $196K NOI (+$70K/year extra!). For growth-focused investors seeking higher yields while maintaining investment-grade floor, Popeyes offers value (fastest-growing chicken QSR + RBI multi-brand backing + 2.5% yield premium).
What is the RBI corporate guarantee, and why does it matter?
RBI corporate guarantee means Popeyes leases are backed by Restaurant Brands International Inc. (parent company, $7B+ revenue, NYSE: QSR) NOT individual franchisees. RBI also owns: (1) Tim Hortons (4,000+ locations, Canada coffee leader, $4B revenue), (2) Burger King (18,000+ global, 7,000 US, $2B US revenue), (3) Firehouse Subs (1,200+ locations). Multi-brand portfolio diversification means: If Popeyes struggles → Tim Hortons/Burger King revenue offsets (corporate stays solvent, pays rent). Why critical for Popeyes: 99% franchised model = reliant on franchisee success, BUT corporate guarantee shifts credit risk from unknown franchisee to RBI $7B institutional backing. For NNN investors: Even if individual Popeyes franchisee fails, RBI continues paying rent through lease term—structural protection from operational challenges. Always verify lease shows “guaranteed by Restaurant Brands International Inc.” (not franchisee personal guarantee).
What happens if Popeyes closes my property’s location?
Popeyes rarely closes locations—aggressive expansion (200+ new stores annually, targeting 10,000+ global long-term). If closure occurs: (1) RBI corporate guarantee means Restaurant Brands International continues paying rent through remaining lease term (landlord still receives income regardless of operational decision), (2) Fee simple ownership means investor owns land + building (can lease to Chick-fil-A, KFC, or other chicken QSR tenant), (3) Strategic location (high-traffic urban corridors) are easily re-tenanted (chicken QSR sites valuable). Historical precedent: Popeyes closures <10 annually out of 3,600+ global stores (<0.3% closure rate). More likely: Popeyes renews because fastest-growing chicken QSR (expansion mode, not contraction), RBI capital support (parent company funding growth), franchisee profitability ($1.8M AUV, 15-18% margins support lease payments).
Why does Popeyes focus on urban markets vs suburban (like Chick-fil-A)?
Popeyes Louisiana Creole heritage resonates in urban/diverse demographics (bold flavors, cultural authenticity, Black-owned heritage pre-RBI) vs Chick-fil-A’s vanilla Christian positioning (suburban affluent, family-friendly). Urban advantages for Popeyes: (1) Bold flavor preference (multicultural populations favor spicy Cajun vs mild Chick-fil-A), (2) Cultural connection (New Orleans roots, Jazz/culinary heritage, community authenticity), (3) 7-day operation (urban markets value weekend access vs suburban Chick-fil-A closed Sundays), (4) Pricing acceptance ($8-10 combos vs KFC $6-8, urban consumers pay premium for quality). Chick-fil-A suburban dominance: Christian values, closed Sundays, playgrounds, family positioning (suburban moms). For NNN investors: Popeyes urban corridor locations (I-285 Atlanta, I-10 Houston, Los Angeles arterials) perform BETTER than suburban because demographics match brand—buy high-traffic urban corridors for Popeyes, avoid low-density suburban (Chick-fil-A territory).
What cap rate should I expect for Popeyes NNN properties?
Popeyes NNN properties typically trade at 6.5-7.5% cap rates, varying by: (1) Market tier (primary metros 6.5-7.0%, secondary 7.0-7.5%, tertiary 7.5-8.0%), (2) Location quality (high-traffic urban corridors = lower cap, suburban/rural = higher cap), (3) Lease term (longer remaining = lower cap), (4) Franchisee strength (multi-unit operators = lower cap, single-unit = higher cap). Comparison: Chick-fil-A 4.0-5.0% (A+ credit, 2.5-3.5% lower caps), KFC 5.5-6.5% (BBB credit Yum! Brands), Raising Cane’s 5.5-6.5% (private, fast-growing). Popeyes 6.5-7.5% caps reflect: (1) BBB- credit (lowest investment-grade tier, higher risk), (2) Fastest-growing chicken QSR (+5-10% same-store sales, growth premium should compress caps over time), (3) RBI corporate guarantee (multi-brand backing provides floor). Value opportunity: Popeyes fastest growth (+5-10%) BUT higher caps (6.5-7.5%) vs slower-growth Chick-fil-A (+3-6%) lower caps (4.0-5.0%)—market inefficiency favors Popeyes for growth investors.
Can I diversify by owning BOTH Burger King AND Popeyes NNN properties (same RBI parent)?
Yes, RBI portfolio diversification strategy is smart NNN approach. Owning BOTH Burger King AND Popeyes provides: (1) Same corporate guarantee (RBI $7B revenue backs BOTH leases), (2) Brand diversification (Burger King value burger QSR, Popeyes premium chicken QSR, different customer segments), (3) Geographic diversification (different locations, traffic patterns), (4) Growth balance (Popeyes +5-10% same-store sales offsets Burger King flat/declining), (5) Multi-brand portfolio stability (if one brand struggles, RBI corporate guarantee from OTHER brands supports). Example portfolio: (1) Burger King Houston $2.3M (6.5% cap, value QSR positioning), (2) Popeyes Atlanta $2.8M (7.0% cap, fastest-growing chicken). Combined: $5.1M invested, $185K combined NOI, BOTH backed by RBI $7B corporate guarantee (Tim Hortons + Burger King + Popeyes revenue). Risk mitigation: If Burger King struggles → Popeyes + Tim Hortons revenue supports corporate guarantee. Smart strategy: Buy MULTIPLE RBI tenants for intra-company diversification!
Ready to Invest in Popeyes NNN Properties?
American Net Lease specializes in Popeyes NNN investments nationwide. Our buyer representation model ensures your interests come first, with expert due diligence on RBI corporate guarantees, same-store sales growth verification, lease structures, urban corridor location quality, and financing optimization. We provide access to Popeyes fee simple and ground lease properties in high-growth Sunbelt markets and urban corridors.
Benefits of working with American Net Lease:
✅ Buyer representation only — We represent YOU, not sellers/brokers (no conflicts)
✅ RBI corporate guarantee verification — We confirm Restaurant Brands International backing
✅ Same-store sales analysis — Verify +5-10% growth trend (fastest chicken QSR)
✅ Lease analysis — Review rent escalations, renewal options, RBI guarantee terms
✅ Location assessment — Urban corridor traffic counts, demographics, drive-thru quality
✅ Financing coordination — 65-70% LTV lenders for BBB- credit Popeyes properties
Browse current Popeyes NNN properties or schedule a consultation:
📞 Call or Text: 239.236.2626
📧 Email: View Popeyes NNN Listings
📄 Download: Chicken QSR Growth NNN Investment Guide
Related Chicken QSR & RBI Portfolio NNN Property Opportunities
RBI Multi-Brand Portfolio (SAME CORPORATE GUARANTEE!):
- Burger King NNN Properties → (BBB- credit, RBI SISTER BRAND!, value QSR positioning)
- Tim Hortons NNN Properties → (IF EXISTS, RBI sister brand, Canada coffee leader)
- Firehouse Subs NNN Properties → (IF EXISTS, RBI sister brand, sandwich QSR)
Chicken QSR Competitors:
- Chick-fil-A NNN Properties → (IF EXISTS, A+ credit, ultra-low 4.0-5.0% caps)
- KFC NNN Properties → (IF EXISTS, BBB credit Yum! Brands, struggling brand)
- Zaxby’s NNN Properties → (IF EXISTS, regional chicken, growing Southeast)
- Raising Cane’s NNN Properties → (IF EXISTS, fast-growing, limited menu)
State-Specific Popeyes Markets:
- Texas NNN Properties → (180+ Popeyes stores, zero tax, largest market!)
- California NNN Properties → (150+ Popeyes stores, urban high-traffic)
- Florida NNN Properties → (140+ Popeyes stores, zero tax, Sunbelt growth)
- Georgia NNN Properties → (100+ Popeyes stores, Atlanta dominance)
Education & Resources:
- Ultimate Triple Net Lease Guide → (Complete NNN education)
- 1031 Exchange NNN Properties → (Tax-deferred strategies)
- All NNN Properties for Sale → (Full national inventory)
Invest in Popeyes NNN properties with confidence:
📞 Call 239.236.2626 | 📧 Contact Us | 📄 Download Chicken QSR Growth Guide