Atlanta NNN Properties for Sale: Southeast Business Capital + Fortune 500 Headquarters Hub
Atlanta NNN properties deliver the ultimate combination of Fortune 500 corporate concentration, world’s busiest airport, competitive state income tax rates, and explosive population growth. As the nation’s 8th largest metro with 6.4+ million residents and $471 billion GDP, Atlanta provides institutional-quality tenants backed by unmatched corporate headquarters density and Southeast economic dominance.
American Net Lease specializes in Atlanta NNN investments throughout metro Atlanta—Fulton, DeKalb, Cobb, Gwinnett, and surrounding counties. Browse current listings or call 239.236.2626 to discuss exclusive opportunities.
Why Invest in Atlanta NNN Properties?
Atlanta offers investors the Southeast’s largest economy anchored by 15 Fortune 500 headquarters (4th nationally), the world’s busiest airport connecting to 80% of the US population within 2 hours, declining state income tax rates (5.19% dropping to 4.99%), and sub-4% retail vacancy. With cap rates of 5.25-7.1% and 75,000+ new residents annually, Atlanta combines institutional tenant quality with exceptional growth fundamentals.
1. 15 Fortune 500 Headquarters = Unmatched Corporate Concentration
Atlanta ranks 4th nationally for Fortune 500 headquarters:
2025 Fortune 500 Atlanta headquarters:
- The Home Depot (#24): Global headquarters, largest home improvement retailer
- UPS (#47): Global headquarters since 1994, 34,500+ metro employees
- Delta Air Lines (#70): Global headquarters adjacent to airport, 34,500 employees
- The Coca-Cola Company (#95): Global headquarters since 1886, 9,000+ Georgia employees
- Southern Company (#163): Major utility holding company
- Genuine Parts (#175): Automotive and industrial parts distributor
- WestRock (#202): Packaging solutions company
Corporate concentration comparison:
- Atlanta: 15 Fortune 500 HQs (4th nationally)
- Miami: 7 Fortune 500 HQs
- Phoenix: 6 Fortune 500 HQs
- Houston: 26 Fortune 500 HQs (2nd nationally)
- New York: 63 Fortune 500 HQs (1st nationally)
Broader corporate presence:
- 75%+ of Fortune 1000 companies have Atlanta operations
- 1,250+ multinational corporations with regional offices
- Combined Fortune 500/1000 revenue: $527.79 billion
- Combined Fortune 500/1000 employees: 1.38 million
NNN investment implications:
- Corporate lunch traffic = restaurant tenant stability
- High-income professionals = premium retail demand
- Long-term headquarters commitment = sustained commercial growth
- Fortune 500 expansion = institutional tenant pipeline
15 Fortune 500 HQs = Institutional tenant quality + workforce stability
2. World’s Busiest Airport: 108 Million Passengers Annually
Hartsfield-Jackson Atlanta International dominates global aviation:
2024 airport statistics:
- Total passengers: 108.1 million (2nd highest in history, +3.3% YoY)
- Global ranking: World’s busiest airport 26 of past 27 years
- Total operations: 796,224 flights (+2.6% YoY)
- Cargo volume: +6% growth
- Daily flights: 1,000+ to 245+ destinations
Delta Air Lines hub:
- 74% of Hartsfield-Jackson flights operated by Delta
- World’s largest airline hub by passenger volume
- 34,500 Atlanta employees
- Non-stop to every major US and international market
Geographic advantage:
- 2-hour flight reaches 80% of US population
- Southeast gateway position
- No major airport competition within 250 miles
- Nashville, Charlotte: 250+ miles away
Capacity expansion:
- Target: 125 million annual passengers within 5 years
- Infrastructure investment ongoing
- Economic impact: $181.4 billion statewide
NNN investment implications:
- Airport corridor industrial/retail demand
- Business traveler hospitality needs
- 24/7 logistics operations supporting essential services
- UPS super hub: 100,000+ packages/hour at peak
World’s busiest airport = Continuous commercial tenant demand
3. Competitive & Declining Georgia Income Tax
Georgia tax rates declining annually through 2027:
State income tax comparison (2025):
- Georgia: 5.19% flat rate (declining 0.10% annually)
- Georgia 2027: 4.99% flat rate (HB 111 codified)
- North Carolina: 4.75% (declining to 3.99% by 2027)
- California: 13.3% top rate
- New York: 10.9% state + 3.876% NYC = 14.776% combined
- Florida/Texas: 0%
Recent tax reform (HB 111, April 2025):
- Codified annual rate reductions retroactive to January 1, 2025
- Corporate tax aligned at 5.19% (same as personal rate)
- Standard deduction: $24,000 married, $12,000 other filers
- Dependent exemption: $4,000 per dependent (up from $3,000 in 2024)
Tax savings example:
- NNN property generating $200K annual income
- California investor pays: $26,600 state tax (13.3%)
- New York investor pays: $29,552 state/city tax (14.776%)
- Georgia investor pays: $10,380 state tax (5.19%)
- Annual savings vs California: $16,220
- Annual savings vs New York: $19,172
Comparison to neighboring states:
- Georgia (5.19%): Competitive with Southeast
- Alabama: 5%
- South Carolina: 6%
- Tennessee/Florida: 0% (but lack Atlanta’s corporate concentration)
Lower taxes + Fortune 500 concentration = Best of both worlds
4. Explosive Population Growth: +75,000 Annually
Metro Atlanta leads Southeast population expansion:
Population statistics (2024-2025):
- Metro Atlanta: 6.411 million (29-county MSA)
- National ranking: 8th largest US metro
- 2023-2024 growth: +75,000 residents (+1.19%)
- Core 11-county region: 5.285 million (+64,440 April 2024-2025)
- Projection: 7.9 million by 2050
Fastest-growing counties nationally:
- Dawson County: #1 nationally (+6.4% growth 2020-2024)
- Jackson County: #4 nationally (+5.8% growth 2020-2024)
- Suburban Atlanta counties driving unprecedented expansion
Demographics:
- College-educated: 45% of city residents (60% metro per Crexi 2025)
- Median household income: $77,655 (city of Atlanta)
- Median age: 33.6 (city)—younger than national average
- 66 colleges/universities supplying talent pipeline
Growth drivers:
- Fortune 500 corporate relocations and expansions
- Film/TV industry: $2.6B direct expenditures FY2024, 60,000 jobs
- Technology sector growth: “Silicon Peach” emerging hub
- Cost of living: 4% below national average
- Quality of life: Sports, culture, dining, outdoor recreation
Population growth + corporate expansion = Sustained retail demand
5. $471 Billion GDP: Southeast’s Largest Economy
Atlanta anchors Georgia’s dominant economic engine:
GDP statistics (2023):
- Metro GDP: $471.66 billion (real chained 2017 dollars)
- National ranking: 10th largest US metro economy
- Global ranking: 15th-18th among world cities
- Georgia state GDP: $800+ billion (8th largest US state)
Employment strength:
- Total employment: 3.124 million jobs (July 2025)
- Job growth: +24,800 projected 2025, +44,300 in 2026, +60,500 in 2027
- Unemployment: 2.9-3.5% (2025) vs 4.3% national average
- Year-over-year growth: +0.7%
Key industries:
- Logistics/transportation: 250,000 workers metro, $83.4B output statewide
- Film/TV production: 20% base + 10% uplift tax credit
- Technology: 126,700 high-tech jobs, #10 US cybercity
- Healthcare: CDC headquarters (15,000 staff), major hospital systems
- Financial services: Federal Reserve Bank of Atlanta, Invesco
Major employers beyond Fortune 500:
- CDC: 15,000+ staff adjacent to Emory University
- Northside Hospital, Piedmont Healthcare, Wellstar Health System
- Publix Super Markets distribution
- Federal Reserve Bank of Atlanta (Midtown)
$471B GDP + 2.9% unemployment = Recession-resistant tenant base
6. Record-Low Retail Vacancy = Landlord Market
Atlanta’s retail market favors property owners:
Retail statistics (Q4 2024 – Q3 2025):
- Retail vacancy: 3.9-4.5% (unchanged to +40 bps YoY)
- Historical norm: 5.3% (current rates well below)
- Record low: 3.4% (Q4 2023)
- Sub-4% vacancy maintained 9 consecutive quarters through Q4 2024
Rental rates:
- Q4 2024: $20.25/SF NNN (all-time high, +6.6% YoY)
- Q3 2025: $19.18/SF NNN (-2.2% QoQ, +0.5% YoY)
- Upward pressure from limited supply, strong demand
Leasing activity:
- Q4 2024: 1.3 million SF (+19% QoQ)
- Q3 2025: 1.0 million SF
- Limited expansion options due to sub-4% vacancy
- Well-positioned space leased immediately
Construction pipeline (supply constrained):
- Q4 2024: 516,158 SF underway (-64% vs year ago)
- Q3 2025: 612,298 SF underway (-42.9% YoY)
- Multi-year low constraining supply
- Limited new deliveries supporting pricing
Recent major lease deals:
- Primemark: Sugarloaf Mills expansion
- AutoZone: South DeKalb Plaza
- Crunch Fitness: Sugarloaf Market
- National brands expanding aggressively
3.9% vacancy = Strong rent growth + minimal downtime risk
7. Strong Cap Rates in Stabilizing Market
Atlanta delivers income + appreciation:
NNN cap rates (2025):
- Average range: 5.25-7.1% (Georgia retail market)
- Credit-worthy tenants: Low-to-mid 5% range
- Short-term credit deals: Above 6% range
- Smaller operators: Above 7% range
Q4 2024 retail investment data:
- Average cap rate: 7.1%
- Average sale price: $207/SF
- Properties sold (trailing year): 715
Notable recent sales:
- Cobb Place: 335,190 SF, $189/SF, 99% occupied
- East West Crossroads: 198,052 SF, $98/SF, 6.4% cap, Walmart-anchored
Investment financing (2025):
- Lending rates: 5.75-6.5% (down from 2023-2024 highs)
- Federal Reserve benchmark: 4.00-4.25%
- Positive leverage scenarios emerging
- Down payment: 30-40% typical
- Cash buyers dominating under $3M
Tax advantages:
- 100% bonus depreciation restored permanently (Big Beautiful Bill, July 2025)
- 10-15 bps cap rate compression in gas stations post-restoration
- Cost segregation ROI increased 66% vs 2024’s 60% bonus rate
Appreciation potential:
- Buckhead: 5-7% annually
- Midtown: 5-8% annually
- Cumberland/Central Perimeter: 4-6% annually
- Growth suburbs (Gwinnett, North Fulton): 5-7% annually
Total return:
- Cap rate: 5.25-7.1% income
- Appreciation: 4-7% value growth
- Total: 9.25-14% combined return potential
Income + appreciation + tax advantages = Triple advantage
8. Diversified Economy: Logistics, Film, Tech, Healthcare
Atlanta’s economy spans multiple recession-resistant sectors:
Logistics & Transportation:
- 250,000 metro workers
- $83.4 billion statewide output (2021)
- UPS super hub: 100,000+ packages/hour peak
- Port of Savannah access: 250 miles (4th busiest US port)
- I-75, I-85, I-20 convergence
Film & Television:
- Direct expenditures: $2.6 billion FY2024
- Jobs supported: 60,000 statewide
- Tax incentive: 20% base + 10% uplift credit
- Netflix, Disney, Warner Bros. productions
- “Hollywood of the South” designation
Technology:
- High-tech jobs: 126,700 metro
- Ranking: #10 US cybercity
- Georgia Tech talent pipeline
- Atlanta Tech Village + emerging startup ecosystem
- Information sector: +11.1% growth 2024-2025
Healthcare:
- CDC: 15,000 staff (global headquarters)
- Emory University research complex
- Major hospital systems: Northside, Piedmont, Wellstar
- Education/health services: +5% growth 2024-2025
Professional Services:
- Professional/business services: +7.5% growth 2024-2025
- Federal Reserve Bank of Atlanta (Midtown)
- Invesco: $778.7 billion AUM
- Southern Company: 264,300 SF Midtown Center II lease (2024, largest office lease)
Diversified economy = Multiple demand drivers for NNN tenants
Atlanta NNN Investment Strategies
Buckhead Financial District
Targeting Atlanta’s premier corporate submarket:
Target areas:
- Buckhead Avenue corridor
- Lenox Square/Phipps Plaza surrounds
- Atlanta Tech Village vicinity
- Peachtree Road prime retail
Advantages:
- Financial services concentration (investment, banking, insurance)
- Class A/B office: $34.50/SF average retail rents
- Expanding technology environment
- MARTA rail access + bike lanes + scooter infrastructure
- Phipps Plaza mixed-use redevelopment (hotel, office, residential)
Investment profile:
- Purchase: $3M-8M
- Cap rate: 5.0-6.0%
- Lease: 10-15 years
- Focus: Credit quality + appreciation
Best for: Appreciation-focused investors seeking premium locations
Midtown Atlanta
Targeting Atlanta’s amenity-rich urban core:
Target areas:
- Atlantic Station mixed-use
- Midtown Mile retail corridor
- Ponce City Market surrounds
- Federal Reserve Bank vicinity
Advantages:
- Major office/retail submarket
- Class A office: $38/SF, Class B: $30/SF
- Strong demand concentration
- Transit-accessible (MARTA rail hub)
- Chick-fil-A extension office: 725 Ponce (40,000 SF, 250 employees)
Investment profile:
- Purchase: $2M-6M
- Cap rate: 5.5-6.5%
- Lease: 10-20 years
- Focus: Stability + urban amenities
Best for: Urban core investors prioritizing walkability and transit access
Cumberland-Galleria
Targeting Truist Park entertainment district:
Target areas:
- The Battery mixed-use development
- Cumberland Mall surrounds
- Galleria office corridor
- I-75/I-285 interchange retail
Advantages:
- Truist Park (Atlanta Braves): Major entertainment anchor
- The Battery: Retail, restaurants, concerts, events
- Class A office tower concentration
- Strong CID (Community Improvement District) infrastructure
- Rising prices + strong absorption
Investment profile:
- Purchase: $2M-5M
- Cap rate: 5.5-6.5%
- Lease: 10-20 years
- Focus: Entertainment-driven traffic + corporate demand
Best for: Investors seeking entertainment district synergy
Central Perimeter
Targeting Dunwoody/Sandy Springs live-work-play hub:
Target areas:
- Perimeter Center retail
- Sandy Springs City Springs district
- Dunwoody MARTA station area
- Medical Center transit-oriented development
Advantages:
- Mixed-use developments + live-work-play focus
- Strong CID investment driving infrastructure
- Office: $32/SF Class A, $22/SF Class B
- Rising prices + competitive cap rates 6.0-7.5%
- Population/employment expansion driving NOI growth
- Newell Brands: 180,000 SF Sandy Springs (2024, largest Central Perimeter lease since 2018)
Investment profile:
- Purchase: $1.5M-4M
- Cap rate: 6.0-7.0%
- Lease: 10-20 years
- Focus: Value + growth potential
Best for: Value investors seeking suburban growth trajectory
North Fulton (Alpharetta, Johns Creek, Roswell)
Targeting Atlanta’s affluent northern suburbs:
Target areas:
- Alpharetta Avalon mixed-use
- Johns Creek Town Center
- Roswell Historic District retail
- North Point Mall corridor
Advantages:
- Class A/A- space dominates market
- Average 7,500 SF spaces, $24/SF rents
- Mid-sized to larger corporate/back-office users
- Coworking expansion focus
- Affluent demographics + top schools
Investment profile:
- Purchase: $2M-5M
- Cap rate: 5.5-6.5%
- Lease: 10-20 years
- Focus: Premium tenants + affluent demographics
Best for: Conservative investors prioritizing household income
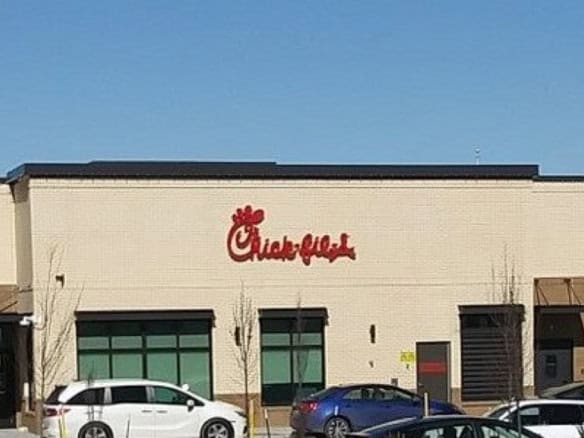
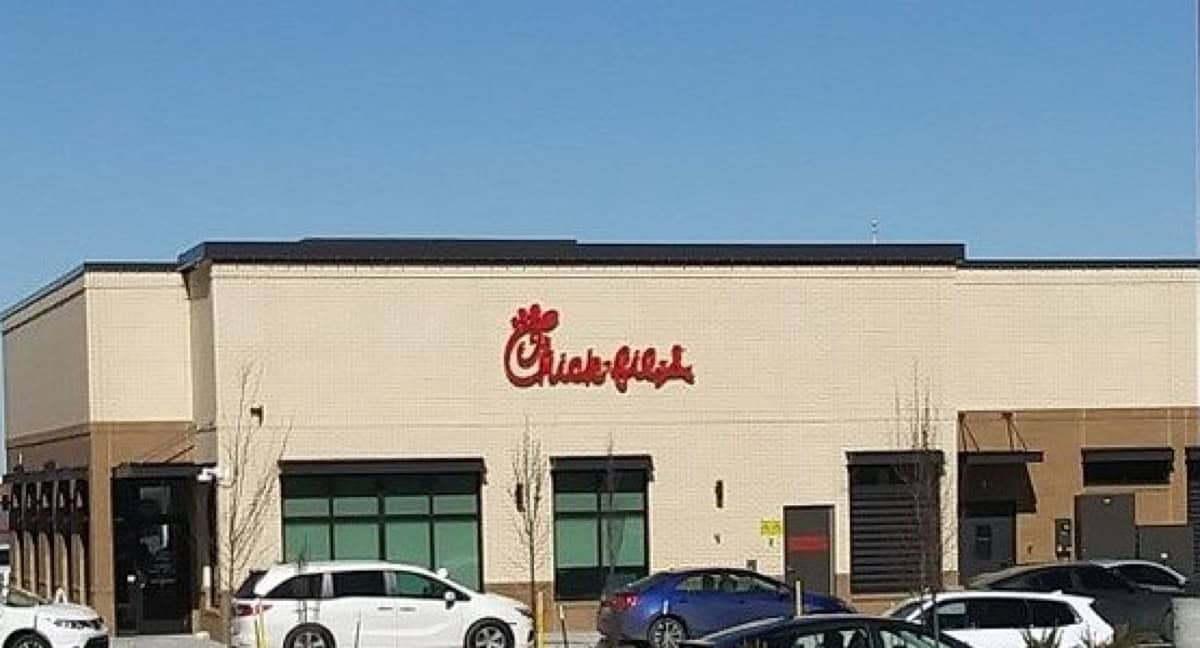
Airport Corridor (South Atlanta)
Targeting logistics and transportation powerhouse:
Target areas:
- Hartsfield-Jackson adjacent retail
- College Park (Chick-fil-A HQ adjacent)
- I-75 South/I-85 South interchange
- Camp Creek Parkway corridor
Advantages:
- Delta Air Lines: 34,500 Atlanta employees
- UPS super hub (100,000+ packages/hour peak)
- 24/7 logistics operations
- Chick-fil-A global headquarters: College Park (3,000+ corporate staff)
- Airport expansion supporting long-term growth
Investment profile:
- Purchase: $1M-3M
- Cap rate: 6.5-7.5%
- Lease: 15-20 years
- Focus: Yield + logistics demand
Best for: Income-focused investors seeking higher yields
Gwinnett County
Targeting Atlanta’s fastest-growing suburban market:
Target areas:
- Sugarloaf Mills corridor
- Duluth Town Center
- Lawrenceville Square
- I-85 Northeast corridor
Advantages:
- 29% population increase driving retail demand
- I-85 corridor growth + Infinite Energy Center
- Retail/QSR/essential services expansion
- Lower entry prices than intown Atlanta
- Strong appreciation potential
Investment profile:
- Purchase: $1M-3M
- Cap rate: 6.5-7.5%
- Lease: 15-20 years
- Focus: Growth + higher yields
Best for: Growth-focused investors seeking appreciation
Evaluating Atlanta NNN Investments
Submarket Selection Criteria
Choosing the right Atlanta submarket:
Population dynamics:
- Historical growth: 5-10 year trends by county
- Projected growth: Gwinnett, Forsyth, Cherokee leading expansion
- Employment centers: Buckhead, Midtown, Airport, Perimeter
- School districts: Quality impacts residential values (Fulton, Forsyth top-rated)
Economic factors:
- Major employers: Fortune 500 HQs, CDC, Delta, UPS
- Income levels: Median household by ZIP code
- Development: Mixed-use pipeline, Beltline expansion
- Infrastructure: MARTA access, highway connectivity
Retail environment:
- Competition: 3.9% vacancy = limited supply
- Traffic: GDOT vehicle counts
- Corporate density: Fortune 500 proximity
- Daytime population: Office worker concentration
Property-Specific Due Diligence
Atlanta-specific considerations:
Weather and infrastructure:
- No hurricane exposure (unlike Florida coastal markets)
- Occasional ice/snow events (1-3 days annually)
- No flood zone concerns for most properties
- Tornado risk: Standard building codes adequate
Environmental assessment:
- Phase I: Standard protocol
- Underground storage tanks: Gas stations especially
- Brownfield sites: Industrial areas (verify history)
- Soil conditions: Clay-heavy (foundation considerations)
Property tax verification:
- Georgia rates: 0.8-1.2% (comparable to Florida)
- Millage rates vary significantly by county
- Fulton County highest rates; Cherokee/Forsyth lower
- NNN structure: Tenant pays (verify in lease)
Title & survey:
- Survey: Standard requirements
- Easements: Utility, drainage, access
- Zoning: Verify commercial use allowed
- Historic districts: Buckhead, Midtown areas (preservation rules)
Tenant Performance in Atlanta
Atlanta market advantages for tenants:
Cost advantages:
- Lower operating costs than Northeast/California
- Competitive labor market
- Strong population growth = customer base expansion
- Fortune 500 corporate accounts
Performance metrics:
- Atlanta stores: Often exceed national chain averages
- Corporate lunch traffic: Buckhead, Midtown boost weekday sales
- Film industry spending: Production crews fuel retail
- Convention traffic: Georgia World Congress Center
Tenant stability considerations:
- Diversified economy supports spending across sectors
- Fortune 500 employment = stable customer base
- Population growth adds 75K+ consumers annually
- Lower cost of living = higher discretionary income
Current Atlanta NNN Properties for Sale
[DYNAMIC PROPERTY FEED FROM YOUR LISTINGS DATABASE]
Featured Atlanta NNN Listings:
[houzez_grids property_city=”Atlanta” posts_limit=”9″ columns=”3″]
Looking for specific Atlanta NNN properties by submarket or tenant? Contact our specialists at 239.236.2626 for exclusive metro Atlanta opportunities.
Atlanta Investment Case Study
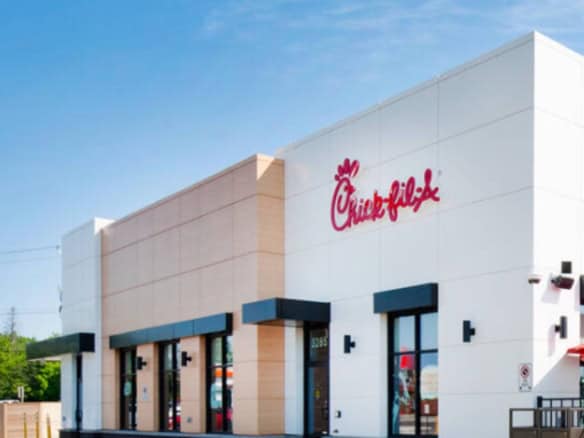
Investment Profile: Chick-fil-A Ground Lease — Buckhead
Property Details:
- Tenant: Chick-fil-A, Inc. (privately held, investment-grade equivalent)
- Guarantee: Corporate guarantee (100% Chick-fil-A corporate ownership model)
- Purchase Price: $4,200,000
- Cap Rate: 5.25%
- Annual NOI: $220,500
- Lease Term: 15 years remaining
- Rent Increases: 10% every 5 years
- Location: Buckhead, Atlanta (financial district)
Property Features:
- 4,500 sq ft building on 1.2 acres
- Dual drive-thru lanes
- Premium Buckhead location
- Free-standing building, ground lease structure
- Daily traffic: 35,000+ vehicles
- Adjacent to Fortune 500 office concentration
Market Details:
- Buckhead office inventory: 10+ million SF
- Corporate lunch traffic: Premium weekday sales
- Average household income (3-mile radius): $125,000+
- Competition: Limited—Chick-fil-A site selection stringent
- Restaurant closed Sundays: Lease accounts for 6-day operation
Investor Profile: California 1031 exchange from Los Angeles retail strip center. Sold at 3.75% cap ($8.5M, $3.2M gain). Sought: exit 13.3% CA state tax, premium corporate tenant, minimal management, Southeast diversification.
Tax advantage:
- Annual NOI: $220,500
- California state tax saved: $29,327 (13.3%)
- Georgia state tax: $11,444 (5.19%)
- Annual savings: $17,883
- 15-year savings: $268,245
Tenant quality:
- Chick-fil-A: $23B+ system-wide sales (2024)
- 100% corporate ownership (unlike franchised competitors)
- No franchisee bankruptcy risk
- Highest sales per store of any QSR
- Chick-fil-A HQ: College Park, Atlanta (3,000+ corporate staff)
Performance to Date:
- 100% on-time rent payments (18 months)
- Zero landlord involvement (ground lease structure)
- Sales exceeding projections (Buckhead corporate traffic)
- Property appreciated 7% since purchase
- Second Buckhead location planned by tenant
15-Year Income Projection:
- Years 1-5: $220,500 annual NOI
- Years 6-10: $242,550 annual NOI (after 10% increase)
- Years 11-15: $266,805 annual NOI (after 10% increase)
- Total 15-year income: $3,647,775
- State tax savings vs California: $268,245
- Projected value (Year 15): $5.5M+ (Buckhead appreciation)
- Total return: 12-15% IRR (income + appreciation + tax savings)
Investor testimonial: “I’d owned California retail for 20 years—always chasing tenant renewals and dealing with state tax creep. Chick-fil-A’s 100% corporate model means I never worry about franchisee financial health. The Buckhead location consistently outperforms projections because every Fortune 500 office worker within a mile knows it’s the best lunch option. My California tax savings alone funded a vacation property. Atlanta was the right move—Fortune 500 headquarters, lower taxes, and the strongest QSR tenant in America.”
Frequently Asked Questions
Why is Atlanta a top market for NNN investment?
Atlanta combines advantages no other Southeast metro offers: 15 Fortune 500 headquarters (4th nationally), world’s busiest airport (108M passengers), declining state income tax (5.19% to 4.99%), and 6.4+ million metro population growing 75,000+ annually. The 3.9% retail vacancy is among the tightest in the Southeast—tenant demand exceeds available space. With Home Depot, UPS, Delta, Coca-Cola, and Chick-fil-A headquartered locally, high-income professional density drives premium retail performance. Cap rates of 5.25-7.1% offer attractive yields with 4-7% annual appreciation potential in prime submarkets. The diversified economy (logistics, film, tech, healthcare) provides multiple demand drivers unlike single-industry markets.
What are typical cap rates for Atlanta NNN properties?
Atlanta NNN properties offer 5.25-7.1% cap rates (2025, stabilized after 12 quarters of expansion). By quality tier: credit-worthy national tenants trade at low-to-mid 5% range, short-term credit deals at 6%+, smaller operators at 7%+. By submarket: Buckhead/Midtown command 5.0-6.0% (premium), Central Perimeter/Cumberland 5.5-6.5%, Airport Corridor/Gwinnett 6.5-7.5% (higher yields). Atlanta cap rates are 25-75 basis points higher than Miami but comparable to Houston/Dallas markets. After-tax returns benefit from declining state tax rates (5.19% dropping to 4.99% by 2027) plus 100% bonus depreciation restoration.
How does Atlanta compare to other Southeast markets for NNN investing?
Atlanta offers distinct advantages within the Southeast. Atlanta vs Miami: Lower entry prices, higher cap rates, declining state tax (vs 0%), Fortune 500 concentration (15 vs 7), no hurricane risk. Atlanta vs Charlotte: Larger economy ($471B vs $200B GDP), more Fortune 500 HQs (15 vs 8), world’s busiest airport. Atlanta vs Nashville: Significantly larger metro (6.4M vs 2.0M), more corporate HQs, established infrastructure. Atlanta considerations: 5.19% state income tax (vs Florida’s 0%), but Fortune 500 density and corporate tenant quality offset. Best for: Investors seeking institutional tenant quality, Fortune 500 exposure, and balanced income/appreciation without coastal insurance costs.
Is Atlanta a good market for 1031 exchange investors?
Absolutely. Atlanta is a premier 1031 exchange destination: declining state income tax (5.19% to 4.99%), Fortune 500 headquarters concentration ensuring tenant demand, no hurricane/flood insurance concerns, strong appreciation in premium submarkets. Popular strategy: Sell California/New York property, exchange into Atlanta, save 8-10% in state tax annually while gaining Fortune 500 tenant quality. Example: Sell LA property with $3M gain, buy Atlanta NNN for $4M, defer federal capital gains, pay only 5.19% Georgia tax (vs 13.3% California). Atlanta 1031 advantages: Multiple quality submarkets (Buckhead, Midtown, Perimeter, Airport), investment-grade tenants, corporate-guaranteed leases, no coastal risks.
What Atlanta submarkets offer the best NNN opportunities?
Premium submarkets by investment strategy: Appreciation + Credit: Buckhead (financial services concentration, $34.50/SF retail), Midtown (transit-accessible, Class A office), North Fulton (affluent demographics, Alpharetta Avalon). Balanced Income + Growth: Central Perimeter (Sandy Springs/Dunwoody, mixed-use), Cumberland-Galleria (Truist Park entertainment), Decatur (established residential). Maximum Yield: Airport Corridor (Delta, UPS logistics), Gwinnett County (I-85 growth corridor, 29% population increase), Cobb County suburban. Ideal features: Population growth 2%+ annually, household income $75K+, Fortune 500 employment proximity, MARTA access (transit-oriented locations), strong school districts.
What industries drive Atlanta’s NNN tenant demand?
Atlanta’s diversified economy supports multiple NNN tenant categories. Logistics/Transportation (250,000 workers, UPS, Delta, Port of Savannah access): convenience stores, QSR, auto services along I-85/I-75 corridors. Film/TV ($2.6B annual expenditures, 60,000 jobs): restaurants, services near production facilities, Fayetteville/Covington studio districts. Technology (126,700 high-tech jobs, Georgia Tech pipeline): urban retail in Midtown, Atlantic Station, Ponce City Market area. Healthcare (CDC, Emory, major hospital systems): medical office, pharmacy, urgent care near hospital campuses. Fortune 500 Corporate (15 headquarters, 1.38M employees): QSR, coffee, financial services retail in Buckhead, Midtown, Perimeter. This diversification insulates Atlanta from single-industry downturns.
Do Atlanta tenants perform well compared to other markets?
Yes, Atlanta tenants frequently outperform national chain averages due to: Fortune 500 corporate lunch traffic, population growth (+75K annually), diversified economy, and lower operating costs. Specific advantages: Buckhead/Midtown lunch traffic from corporate headquarters, convention/event traffic from Georgia World Congress Center, film production spending ($2.6B annually). Tenant performance metrics: Higher sales per store than coastal markets with similar demographics, stronger rent coverage ratios, national brand expansion continues. Considerations: Some suburban locations depend on single employer—verify employment center diversity. Fortune 500 concentration (15 HQs) creates stable, high-income customer base unlike tourism-dependent markets.
Next Steps: Invest in Atlanta NNN Properties
Ready to access the Southeast’s business capital, America’s Fortune 500 headquarters hub, and the world’s busiest airport—all with declining state income tax? American Net Lease provides exclusive Atlanta NNN opportunities across Fulton, DeKalb, Cobb, Gwinnett, and surrounding counties.
Work With American Net Lease
Why investors choose us for Atlanta NNN acquisitions:
- Metro-wide expertise: Buckhead, Midtown, Perimeter, Airport, Gwinnett knowledge
- Submarket analysis: Fortune 500 proximity, growth corridors, transit-oriented opportunities
- Tenant analysis: Corporate-guaranteed QSR, convenience, medical, auto services
- Tax strategy: 1031 exchange + Georgia tax planning
- Off-market access: Exclusive listings across metro Atlanta
Schedule Your Free Consultation
Let’s discuss your Atlanta NNN investment strategy and identify properties delivering maximum value.
📞 Call: 239.236.2626
📧 Email: Contact Us
🔍 Browse: View All Atlanta NNN Properties
Additional Resources
Learn More About NNN Investing:
Explore Atlanta-Area Tenants:
Compare Southeast Markets:
Start building passive income with Atlanta NNN properties—Southeast business capital, Fortune 500 headquarters hub, world’s busiest airport. Call 239.236.2626 or request information today.
Last Updated: February 2026